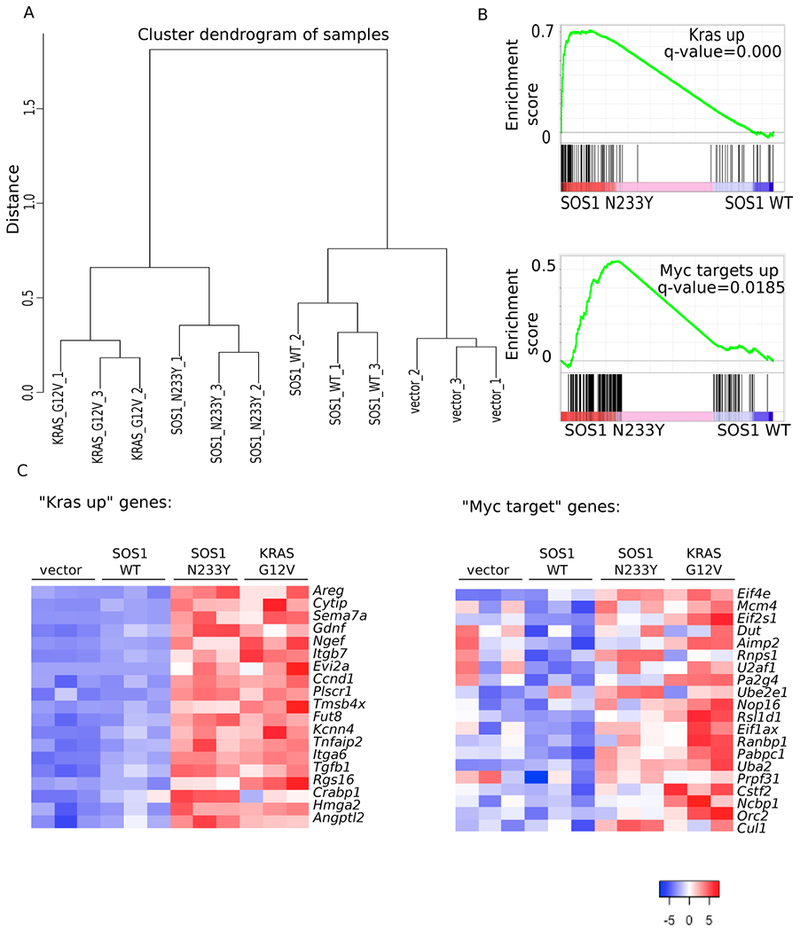
Figure 3: The expression profile of SOS1 N233Y NIH-3T3 cells resembles KRAS G12V NIH-3T3 cells.

A: RNA sequencing was performed on three biological replicates of vector-control, SOS1 wildtype, SOS1 N233Y, and KRAS G12V NIH-3T3 cells. Normalized read counts were used to compute the distance between the samples based on Pearson correlation coefficient, and complete linkage was used to create clusters for the dendrogram.
B: Gene set enrichment analysis was performed using normalized read counts. “Kras up” is the dataset from (63). “Myc targets up” is the dataset from the Molecular Signatures Database Hallmark MYC V1 collection (64).
C: Heat map showing standardized t-statistics (Tij) of normalized expression values for each sample per gene. , where xij=normalized expression value for sample i and gene j, =sample mean for normalized expression of gene j, sj=sample standard deviation for normalized expression of gene j, n=number of samples. “Kras up” refers to the set of genes shown that are also in the “Kras up” set from Figure 3B and (63). “Myc target” refers to the set of genes shown that are also in the “Myc targets up set” from Figure 3B and (64).
