
Figure 6: Combination treatment is effective in vivo, but resistance may develop.
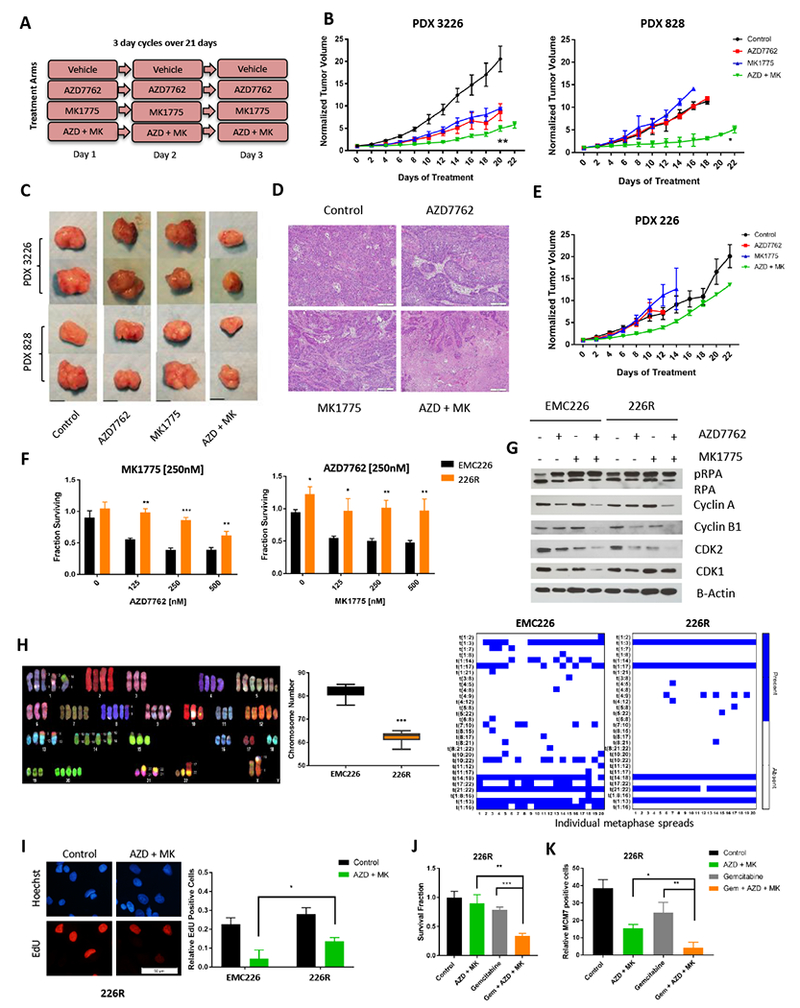
A. Schedule of treatment groups; 3 day cycles repeated over 21 days (n=5 per group, per PDX model). B. PDX3226 and PDX828 were randomized at ~200 mm3 and treated with vehicle (control), single agent, and combinations as indicated for 21 days. Tumor volume was measured every 2 days (* p-value<0.05, ** p-value <0.01 t test). C. Representative images of tumors of PDX models that were harvested at the completion of treatment (scale bar is 1cm). D. Tumors were harvested at the completion of treatment and subjected to hematoxylin and eosin staining. Large areas of necrosis are apparent in combination treated tumors relative to single agents AZD7762 and MK1775. Representative images are shown (scale bar is 100 μm). E. PDX 226 were randomized at ~200 mm3 and treated with vehicle (control), single agent, and combinations as indicated for 21 days. Tumor volume was measured every 2 days. F. The 226R line was treated with the indicated doses of MK1775 and AZD7762 for 72 hours. Cell viability assay was determined by CTG analysis (* p-value <0.05, ** p-value <0.01, *** p-value <0.001 t test). G. Immunoblot analysis of pRPA, Cyclin A, Cyclin B1 CDK1, CDK2 and B-Actin of EMC226 parental and 226R line with indicated treatments (AZD7762 at 250nM, MK1775 at 250nM) for 48 hours. H. Representative image of spectral karyotyping (SKY) of EMC226 parental cells. Chromosome numbers of EMC226 are significantly higher than 226R cells (*** p-value <0.001 t test). Chromosome translocations of EMC226 parental are greater in number and variation than 226R line. I. EMC226 and 226R lines were treated with combination of AZD7762 and MK1775 at 250nM over 48 hours and EdU incorporation was determined. Representative micrograph of 226R cell line is shown (scale bar is 50μm). Quantitation shows the mean and standard deviation of the percent EdU positive cells (* p-value <0.05 t test). J. 226R lines were treated with AZD7762 (250nM) and MK1775 (250nM), single agent gemcitabine (100nM), and triple combination (gemcitabine 100nM, AZD7762 and MK1775 250nM). Cell viability was determined by CTG analysis at 72 hours (** p-value <0.01, *** p-value <0.001 t test). K. Immunofluorescence staining of chromatin bound MCM7 was done in 226R lines after 48 hours treatment of AZD7762 (250nM) and MK1775 (250nM), single agent gemcitabine (100nM), and triple combination (Gem + AZD + MK). Graph shows mean and standard deviation of relative MCM7 positive cells (* p-value <0.05, ** p-value <0.01 t test).