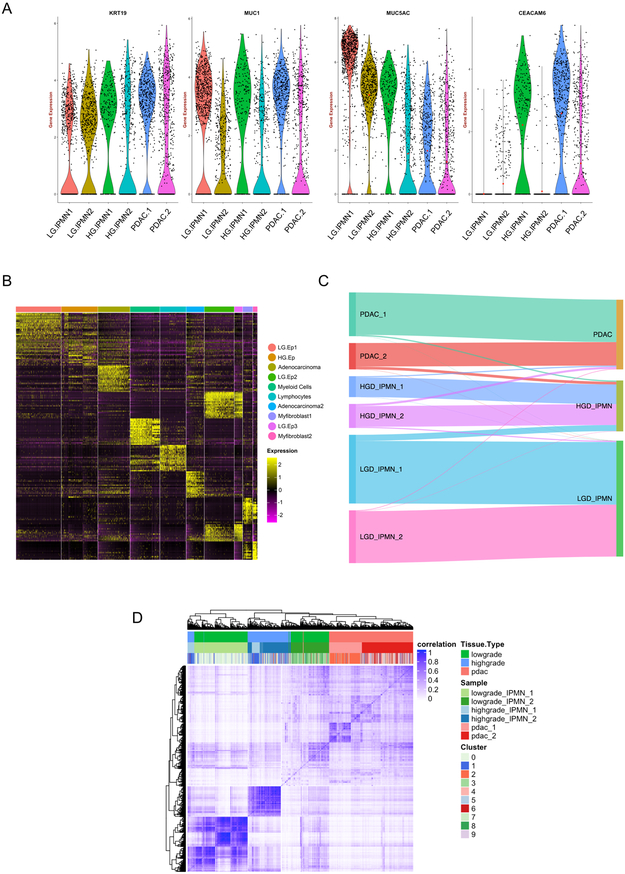
Figure 2:
(A) Violin plots of gene expression across lesions types confirm expression of characteristic PDAC and cystic preneoplasia related markers. (B) Heatmap of the top 20 differentially expressed genes used to identify cell phenotypes across each of the ten discrete clusters indicated by the header. (C) Sankey diagram demonstrating epithelial cells profiled from LGD-IPMNs, HGD-IPMNS, and PDAC tissue and where they reside within annotated tSNE clusters (D) Correlation heatmap of Pearson correlation coefficients of hierarchically clustered individual cells across all lesions, identified by originating lesion type and tSNE cluster.

