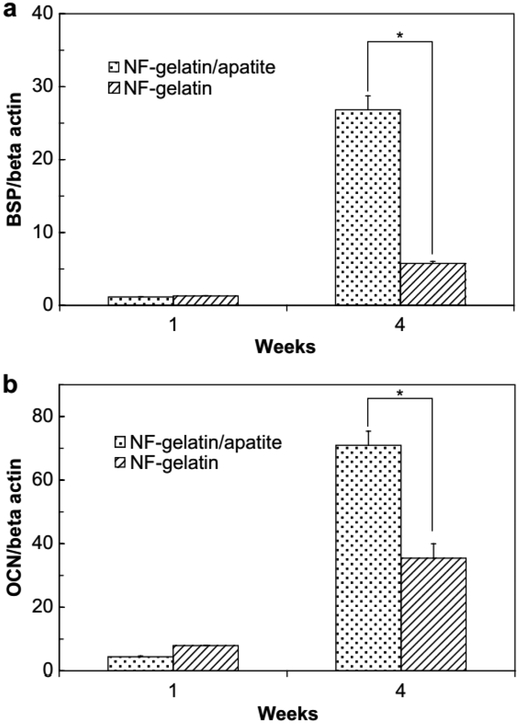
Figure 10.
Quantitative RT-PCR results of bone sialoprotein (BSP) and osteocalcin (OCN) gene expression. MC3T3-E1 cells were cultured on NF-gelatin and NF-gelatin/apatite scaffolds for 1 and 4 weeks. The Y-axis of the figure is the gene expression results normalized by beta actin. (*) represents statistically significant differences (p < 0.05). Reproduced from Ref.[49]

