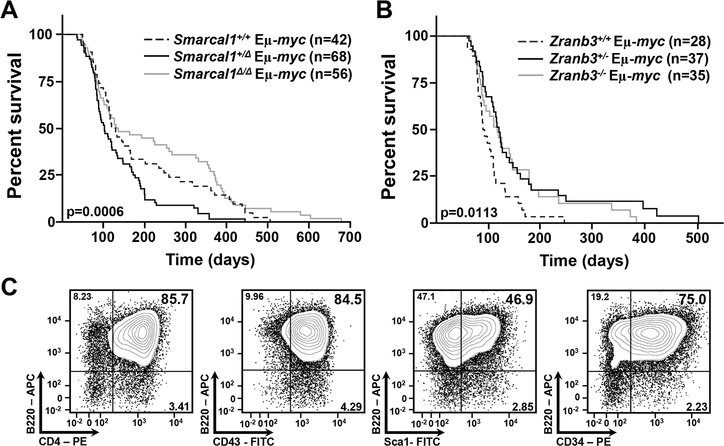
Figure 2. Deficiency of Smarcal1 or Zranb3 significantly alters Myc-induced lymphomagenesis.
A, B) Kaplan-Meier survival curves of mice of the indicated genotypes. Overall P values in figures and p=0.0142 (+/+ vs. +/Δ), p=0.0002 (+/Δ vs. Δ/Δ), p=0.3224 (+/+ vs. Δ/Δ) (B), and p=0.0066 (+/+ vs. +/−), p=0.0199 (+/+ vs. −/−), log-rank tests. Number (n) of mice indicated. C) Representative flow cytometry contour plots of the early precursor B cell lymphomas arising in a fraction of the Smarcal1+/Δ Eμ-myc, Zranb3+/− Eμ-myc, and Zranb3−/− Eμ-myc mice (also see Table 1) using fluorochrome-linked antibodies specific for B cell surface markers (indicated).

