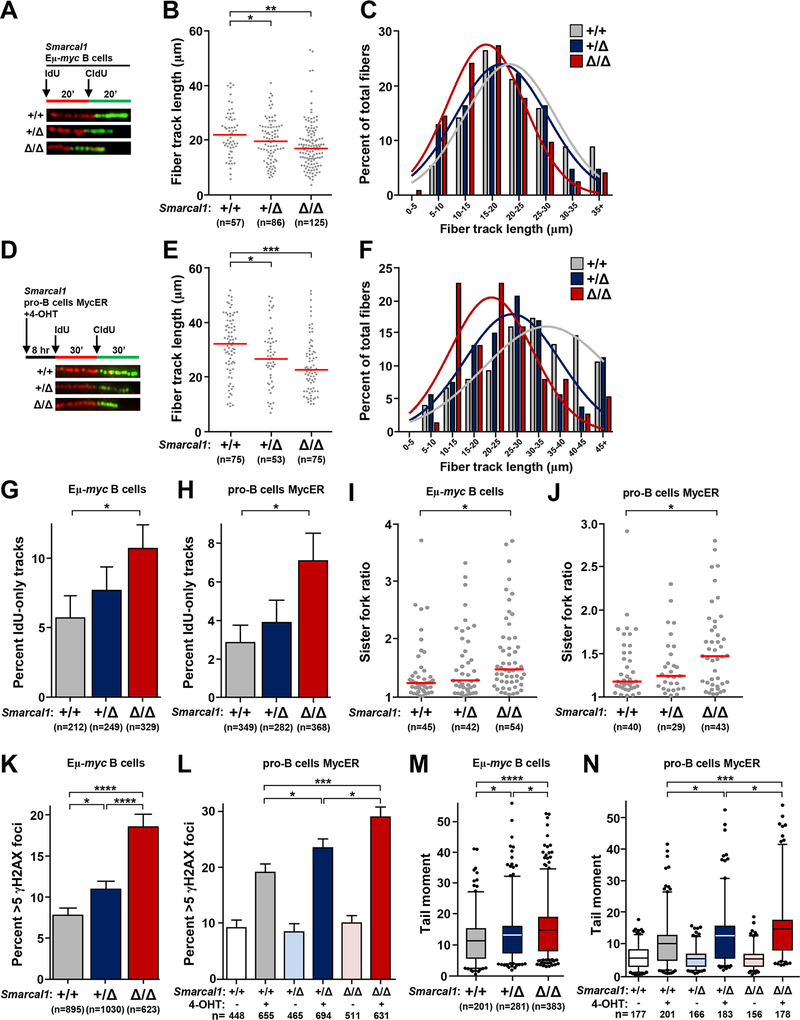
Figure 3. Smarcal1-deficient B cells have increased rates of replication fork collapse with Myc dysregulation.
B cells from Smarcal1+/+ Eμ-myc, Smarcal1+/Δ Eμ-myc, and Smarcal1Δ/Δ Eμ-myc mice were purified from bone marrow (A-C, G, I) or spleen (K, M). Pro-B cell cultures from Smarcal1+/+, Smarcal1+/Δ, and Smarcal1Δ/Δ mice expressing MycER (D-F, H, J, L, N) with MycER activated by the addition of 4-hydroxytamoxifen (4-OHT) for 8 hours. (A, D) Design of DNA fiber labeling experiments and images of representative fiber tracks. B, E) Quantification of total fiber length in purified Eμ-myc B cells (B) and MycER pro-B cells (E); median indicated with red bar. C, F) Fiber length frequencies from (B) and (E), respectively. G, H) Quantification of DNA fibers that only incorporated IdU from Eμ-myc B cells (G) and MycER pro-B cells (H); SEM. I, J) Ratios of measured CldU track lengths from left and right moving forks from the same replication origin from Eμ-myc B cells (I) and MycER pro-B cells (J); median indicated with red bar. K, L) Quantification of immunofluorescence of γH2AX foci in Eμ-myc B cells (K) and MycER pro-B cells (L); SEM. M, N) Box-and-whisker plots of tail moments of Eμ-myc B cells (M) and MycER pro-B cells (N). Line is the median, boxes are the 25th and 75th percentiles, whiskers are the 5th and 95th percentiles. The total number (n) of fibers (B, E), replication structures (G-J), or cells (K-N) analyzed is indicated. All data are from 2–3 independent experiments. One-way ANOVA with Bonferroni correction (B, E, M, N, I, J) or chi-square test (G, H, K, L); *p<0.05, **p<0.01, ***p<0.001, ****p<0.0001.

