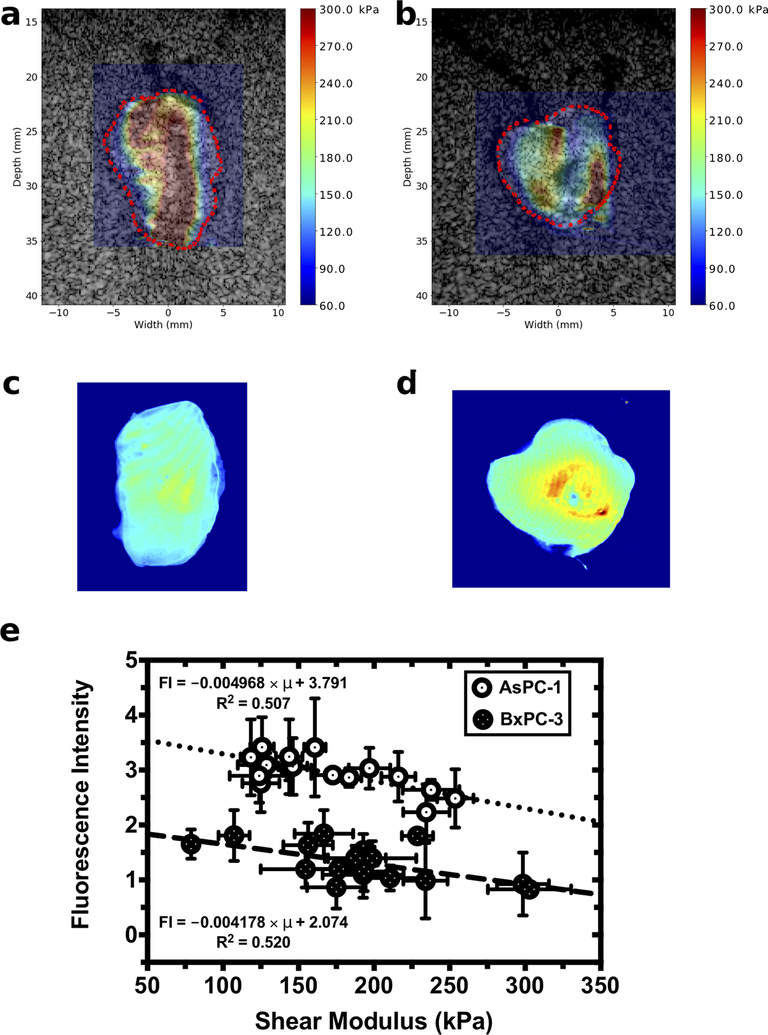
Figure 4:
Calibrated fluorescence intensity maps and elastographic imaging obtained from AsPC-1 and BxPC-3 tumors. Shear modulus overlaid on sonograms for a (a) AsPC-1 tumor and (b) BxPC-3 tumor. Calibrated fluorescence intensity maps obtained from the corresponding (c) AsPC-1 and (d) BxPC-3 tumors. (e) Fluorescence intensity plotted as a function of tumor shear modulus.

