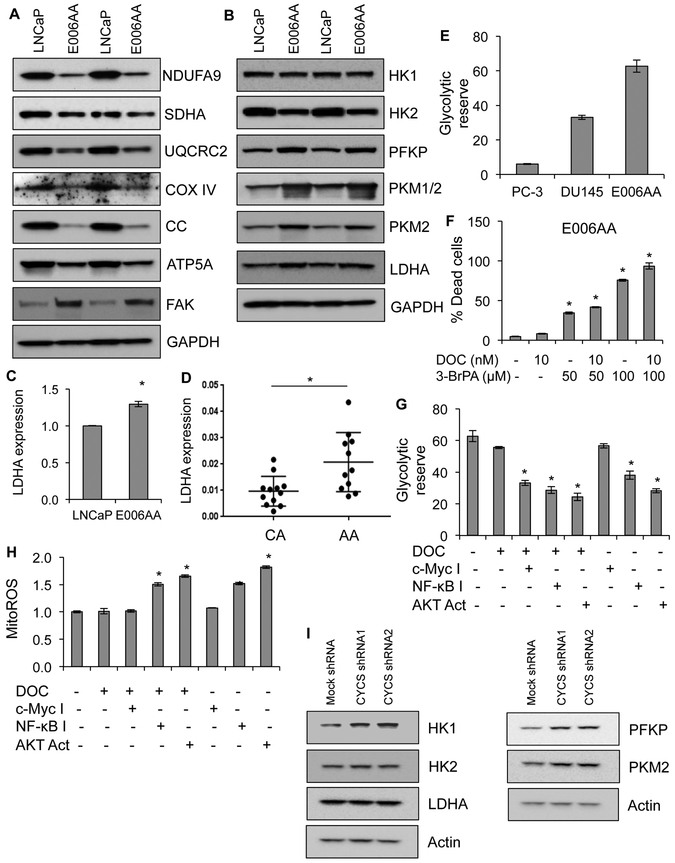
Figure 6. CC-deficiency causes metabolic reprogramming in AA primary tumor and AA PCa cells.
A, Expression levels of OXPHOS complex subunits and FAK in LNCaP and E006AA cells by immunoblot analysis. NDUFA9 for Complex I, succinate dehydrogenase A (SDHA) for Complex II, UQCRC2 for Complex III, cytochrome c oxidase subunit IV (COX IV) for Complex IV; ATP5A for Complex V. GAPDH serves as a loading control. B, Expression level of glycolytic enzymes including focal adhesion kinase (FAK), hexokinase 1 (HK1), hexokinase 2 (HK2), phosphofructokinase platelet isoform (PFKP), pyruvate kinase M ½ (PKM ½), and lactate dehydrogenase A (LDHA) in LNCaP and E006AA cells using immunoblot analysis. GAPDH serves as a loading control. C, Expression of LDHA at mRNA level using RT-PCR in LNCaP and E006AA cells. D, Expression of LDHA at mRNA level using RT-PCR in primary tumor isolated from AA and CA men with PCa. E, Measurement of glycolytic reserve capacity in PC-3, DU145, and E006AA cells using Seahorse XF analyzer. F, Cell death quantification in E006AA cells treated with DOC alone or DOC in combination with glycolytic disruptor 3-BrPA (3-Bromopyruvate) for 24 hrs. G, Measurement of glycolytic reserve capacity using Seahorse XF analyzer in E006AA cells treated with DOC or DOC in combination with either c-Myc inhibitor or NF-κB inhibitor or AKT activator. H, Measurement of mitochondrial ROS production using MitoSOX dye in E006AA cells treated with DOC or DOC in combination with either c-Myc inhibitor or NF-κB inhibitor or AKT activator using flow cytometry. I, Expression level of glycolytic enzymes including hexokinase 1 (HK1), hexokinase 2 (HK2), phosphofructokinase platelet isoform (PFKP), pyruvate kinase M 2 (PKM2), and lactate dehydrogenase A (LDHA) in mock- and CC- silenced LNCaP cells using immunoblot analysis. Actin serves as a loading control. Data represent mean ± SD of 3 independent experiments. Significant differences between means were assessed using analysis of variance (ANOVA) and GraphPad Prism Version 6.0. *p < 0.05 vs respective controls.

