Fig. 3.
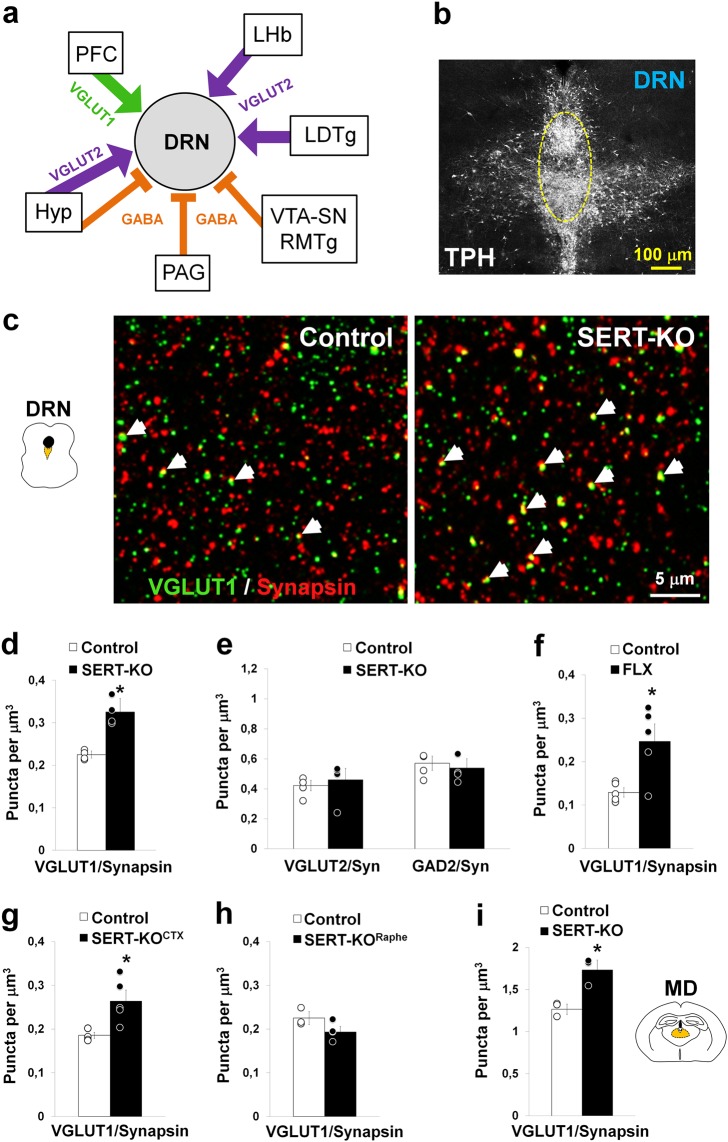
Cortical deletion of SERT results in synaptic hyperinnervation of the DRN. a Diagram summarizing the excitatory glutamate and inhibitory GABAergic synaptic inputs received by the dorsal raphe nucleus (DRN) neurons. Synaptic inputs can be selectively identified in array tomography by the presence of specific synaptic markers including the vesicular glutamate transporter type 1 and 2 (VGLUT1 and VGLUT2, respectively) and the enzyme responsible for GABA synthesis, the glutamate decarboxylase 2 (GAD2). The prefrontal cortex (PFC), lateral habenula (LHb), laterodorsal tegmental nucleus (LDTg), ventral tegmental area (VTA), substantia nigra (SN), rostromedial tegmental nucleus (RMTg), periaqueductal gray (PAG), and hypothalamus (Hyp), have been noted as the main synaptic inputs to the DRN [50, 53, 54]. b Immunolabeling against the 5-HT biosynthetic enzyme tryptophan hydroxylase (TPH) illustrating the distribution of 5-HT neurons in the midbrain DRN. The bracketed area shows the sampling region in the midline DRN used for array tomography quantitative analyses (at P28). c Array tomography projection image of three serial-ultrathin 70-nm-thick sections of the DRN immunolabeled against VGLUT1 (green) and synapsin (red) to specifically identify cortical synaptic boutons. The arrows indicate double-labeled boutons in control and SERT-KO mice. d-e Quantitative analysis of cortical glutamate synaptic boutons (VGLUT1+) (d), and subcortical glutamate (VGLUT2+) and GABAergic (GAD2+) synaptic boutons (e) in the DRN of control and SERT-KO mice (4 mice/genotype; for VGLUT1/Synapsin pairs: F1,6 = 36.45, *p < 0.001; for VGLUT2/Synapsin pairs: F1,6 = 0.24, p = 0.64; and for GAD2/Synapsin pairs: F1,6 = 0.34, p = 0.58). f Analysis of cortical synaptic boutons in the DRN after fluoxetine-treatment (FLX) during the postnatal critical period (P2-14) (5 mice/group; F1,8 = 9.94, *p < 0.02). g-h Density of cortical synaptic boutons in the DRN after conditional SERT invalidation using Emx1bCre/+:Sertfl/fl mice (SERT-KOCTX) (g) and Pet1Cre:Sertfl/fl mice (SERT-KORaphe) (h). (g): 5 mice/genotype (Welch’s statistic = 11.20, *p < 0.03); (h): 3–4 mice/genotype (F1,5 = 3.76, p = 0.11). i Cortical synaptic boutons in the mediodorsal thalamic nucleus (MD) of control and SERT-KO mice (3 mice/genotype; F1,4 = 18.16, *p < 0.02). One-way ANOVA (d, e, f, h, i), and Welch’s t test (g). Error bars represent SEM

