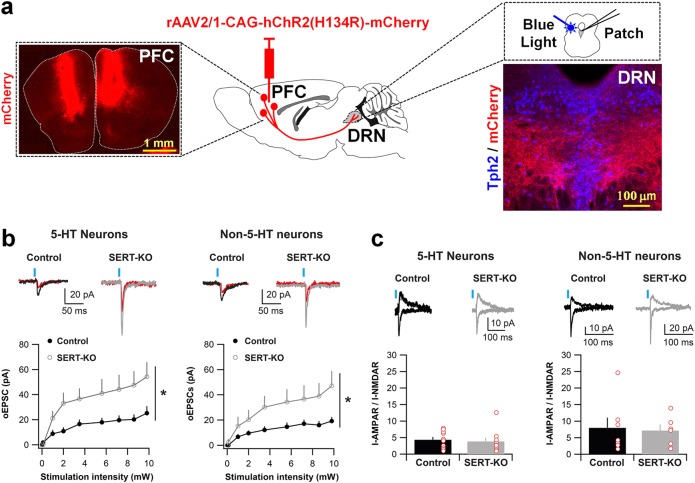
Fig. 4.
Lack of SERT increases the number of functional PFC-to-DRN synapses. a rAAV-CAG-hChR2(H134R)-mCherry was bilaterally injected into the PFC of P4–P5 control or SERT-KO mice. Photograph showing mCherry expression after the PFC AAV injection (upper left). Optogenetic stimulation and electrophysiological patch clamp recordings were made starting at P28 in coronal sections containing the DRN, as shown by the photograph of the immunolabeling of PFC mCherry+ axons innervating to DRN 5-HT neurons, identified by the presence of the enzyme TPH2 (upper right). b Amplitude of optogenetically evoked EPSCs (oEPSCs) at synapses from PFC terminals onto DRN putative 5-HT neurons (left) and non-5-HT neurons (right) at various light stimulation intensities. In control (SERTCre/+) (5-HT: n = 10 cells/5 animals; non-5-HT: n = 7 cells/4 animals); in SERT-KO (SERTCre/Cre) (5-HT: n = 10 cells/3 animals; non-5-HT: n = 6 cells/3 animals). Top: example traces at 9.8 mW (black/gray) and at 2 mW (red) stimulation); Bottom: input/output curves. Two-way ANOVA on 9.8 mW intensity: genotype x cell-type interaction (F1,29 = 0.003, p = 0.95); Genotype main effect (F1,29 = 9.32, *p < 0.01); Cell-type main effect (F1,29 = 0.51, p = 0.48). c AMPAR/NMDAR ratios at synapses from PFC-to-DRN 5-HT neurons (left) and non-5-HT neurons (right) in control (5-HT: n = 10 cells/4 animals; non-5-HT: n = 7 cells/3 animals), and SERT-KO (5-HT: n = 11 cells/3 animals; non-5-HT: n = 6 cells; 3 animals). The AMPAR responses were calculated at the peak of −50 mV, whereas NMDAR responses were determined at + 40 mV, 50 ms after stimulation. Top: example traces; bottom: bar graphs. Two-ways ANOVA: Genotype x Cell-type interaction (F1,30 = 0.007, p = 0.94); Genotype main effect (F1,30 = 0.16, p = 0.69); Cell-type main effect (F1,30 = 4.51, p < 0.05). Blue bars indicate blue light stimulation. Error bars represent SEM

