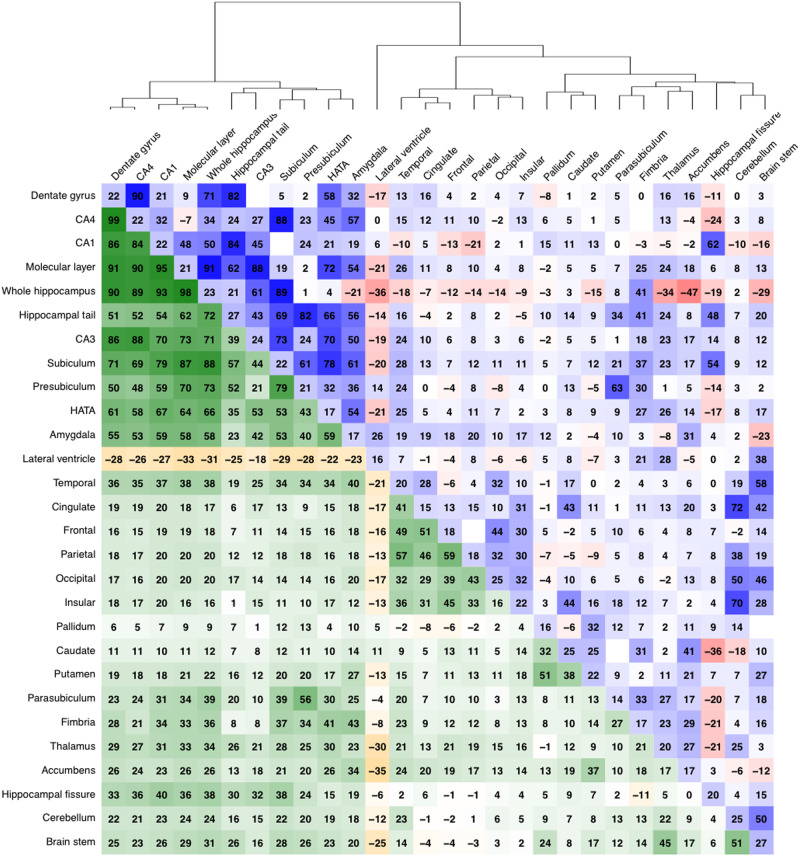
Fig. 1.
Correlation matrix of the volume estimates for the subfields as well as several other cortical and subcortical regions of interest and cerebral lobes. All correlations are multiplied by a factor 100. The volumetric correlations are shown in the lower triangle of the matrix (green–orange), the heritability estimates on the diagonal, and the genetic correlations in the upper triangle (blue–red). The order, indicated by the dendrogram on top, is determined by hierarchical clustering using Ward’s D2 method

