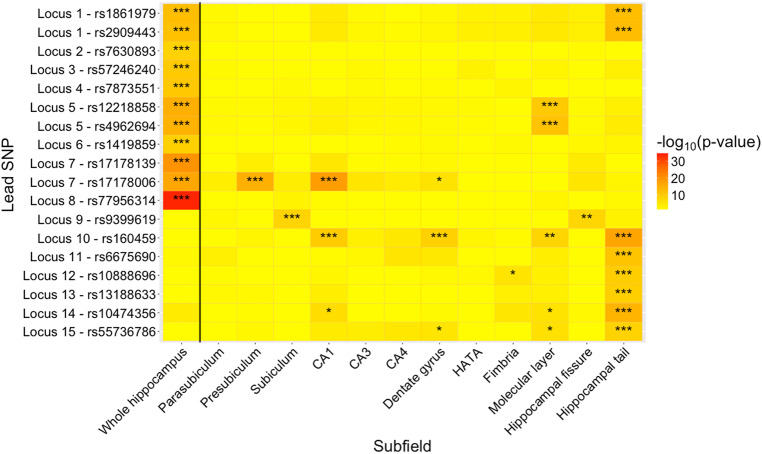
Fig. 2.
Heatmap based on the results from the genome-wide association analyses, showing the p-value for each of the lead SNPs reported in Table 2 (on the y axis) per subfield (on the x axis) volume. High − log10 p-values are shown in red, low values in yellow. Three stars in a field indicate the SNP reached whole-genome significance for that SNP (6.5 × 10⁻⁹), two stars nominal significance (5 × 10⁻⁸) and one star suggestive significance (1 × 10⁻⁶)

