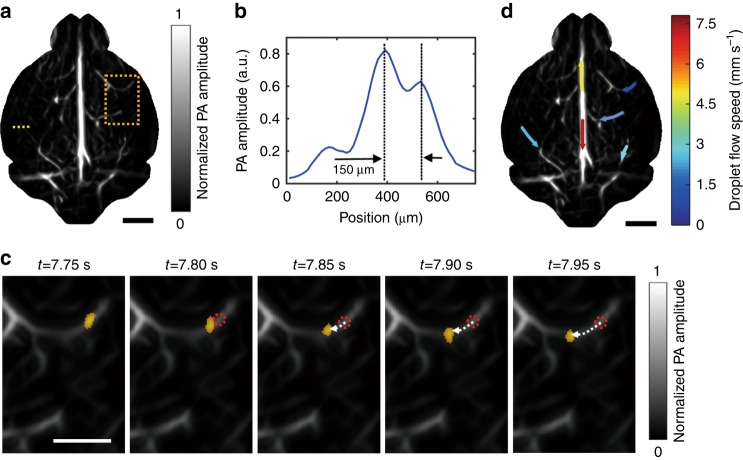
Fig. 3. Tracking of droplets in the brain in vivo.
a A unipolar image of the baseline cortical vasculature that was acquired prior to the injection of droplets, where a Hessian-based Frangi vesselness filter was applied. b A profile of the PA amplitude along the dashed line in a. c The flow of a droplet (orange dot) in brain vessels, which was tracked over time. The droplet images were overlaid on the baseline vascular image in the region that is bounded by the dashed rectangle in a. The dotted red circles indicate the initial locations of the droplets, and the dashed arrows indicate the flow pathway and direction. d The droplet flow velocities for several cortical vessels. The colors indicate the flow speeds, and the arrows indicate the flow directions. The scale bars are 2, 1 and 2 mm in a, c, d, respectively

