
FIGURE 4.
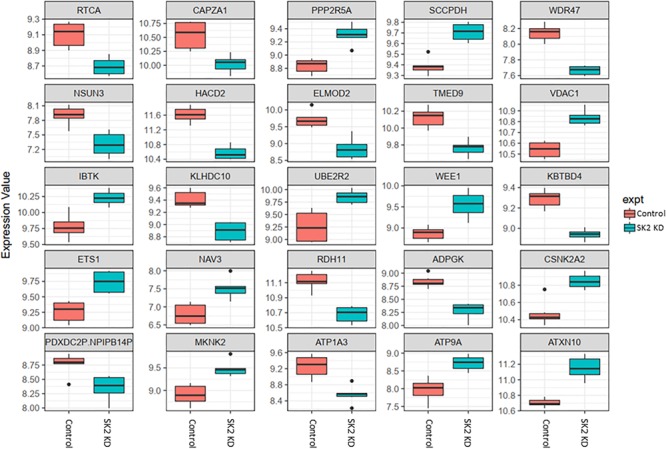
Altered gene expression in response to SK2 knockdown (KD) in prostate cancer cell lines. Human prostate cancer cells lines PC-3 and DU145 were transfected with SK2 siRNA and Affymetrix Clariom S human array was performed as described in materials and methods. Differential expression analysis was performed using the limma version 3.34.4: linear models were determined for each transcript cluster (gene) and an estimate for the global variance calculated by an empirical Bayes approach. A moderated t-statistic was computed for each transcript cluster with the resulting p-values adjusted for multiple testing using Benjamini and Hochberg’s method to control the false discovery rate. Those transcript clusters with an adjusted p-value less than 0.05 were considered to be significantly differentially expressed between the two groups; bars, SEM.