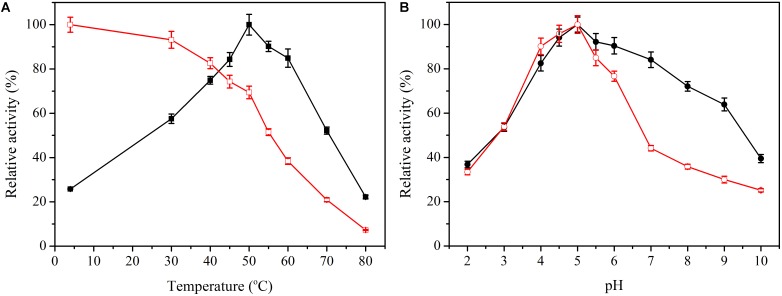
FIGURE 2.
Effect of temperature and pH on activity and stability of Bacillus cellulase. (A) Effect of temperature on activity ( ) and stability (
 ) of Bacillus cellulase. (B) Effect of pH on activity (
 ) and stability (
 ) of Bacillus cellulase. Data points are the average of triplicate measurements, and error bars represent the standard deviation.

