


Figure 2.
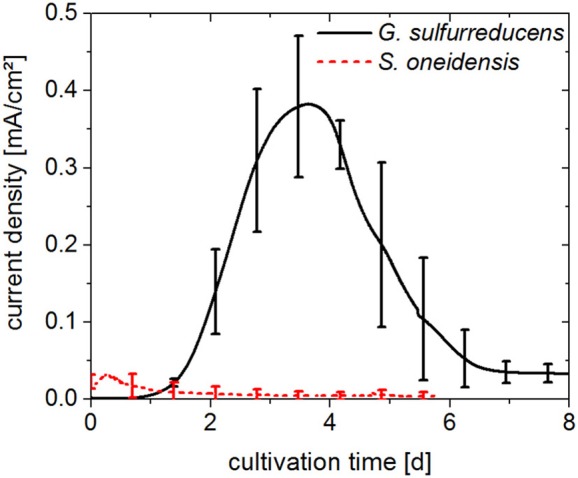
Chronoamperograms (first cultivation cycle) from pure cultures of G. sulfurreducens fed with 10 mM acetate (solid line) and S. oneidensis fed with 5 mM acetate and 5 mM lactate (dotted line). Anode potential: 0.2 VAg/AgCl. Error bars represent standard deviation of biological triplicates. Samples were taken at the beginning and end of experiments.