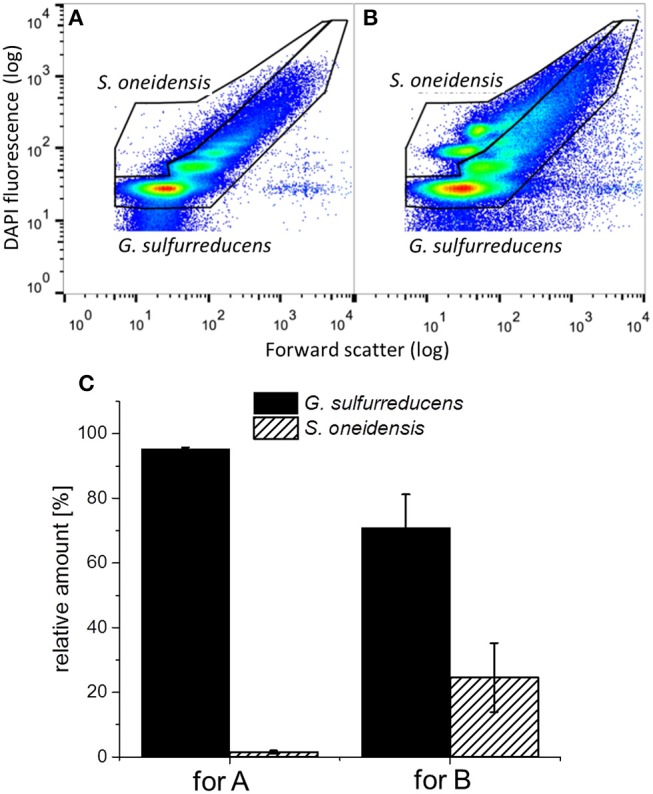
Figure 7.

Representative dot plots from (A) the biofilm and (B) planktonic cells of a G. sulfurreducens/S. oneidensis defined mixed culture and (C) the thereof determined relative amount of cells in the G. sulfurreducens gate (filled) and the S. oneidensis gate (diagonally ruled). Error bars in C represent standard deviation from biological triplicates.
