Figure 2.
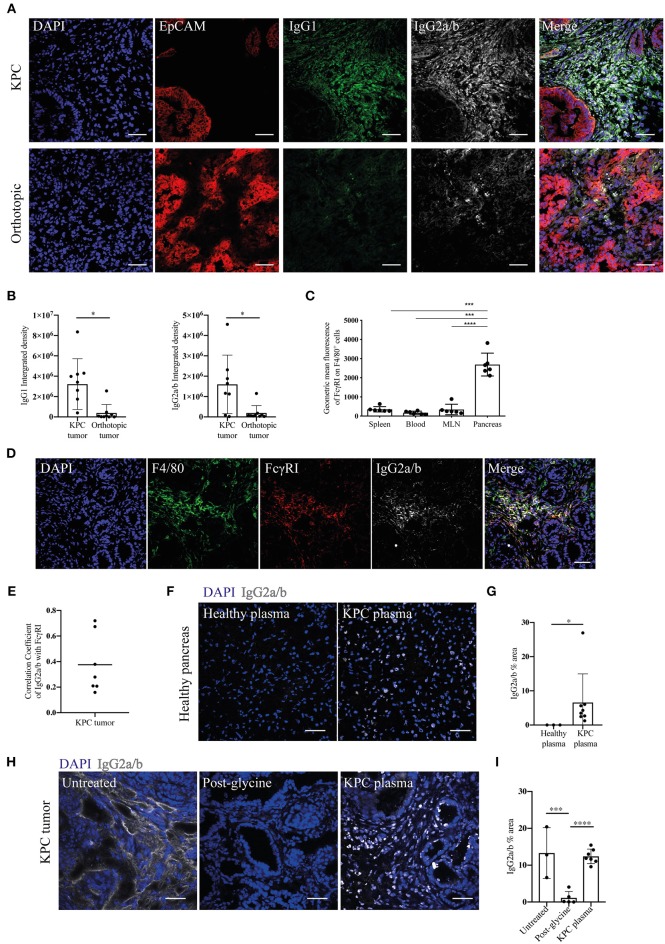
Evidence of immunoglobulin deposition in KPC tumors and IgG2a/b response against pancreatic antigens in KPC mice. (A) Representative immunofluorescence images of immunoglobulin deposition of IgG1 (green) and IgG2a/b (white) near EpCAM positive tumor cells (red) in KPC (n = 3) and orthotopic tumors (n = 4). (B) Quantification of the intensity (integrated density) of IgG1 and IgG2a/b (minus their respective isotype controls) in individual images of KPC and orthotopic tumors. (C) Flow cytometry analysis of geometric mean fluorescence of the marker FcɤRI on F4/80+ CD45+ cells in the spleen, blood, MLN and pancreas tumor of KPC mice. Each data point represents an individual mouse sample and error bars represent SD. Statistical significance was analyzed by unpaired t-test where *p < 0.05, ***p < 0.001 and ****p < 0.0001. (D) Representative immunofluorescence images of colocalization of F4/80 (green), FcɤRI (red) and IgG2a/b (white) deposits, where DAPI (blue) was used as a nuclear marker in KPC tumors (n = 3). (E) Quantification of FcɤRI and IgG2a/b colocalization. The correlation coefficient between IgG2a/b and FcɤRI was calculated using ZEN software on individual images of KPC tumors, where a coefficient of 0 indicates no colocalization and 1 indicates complete colocalization. (F) Binding of plasma from healthy or KPC mice to sections of healthy pancreas, where IgG2a/b (white) was used to detect immunoglobulins and DAPI (blue) was used as a nuclear marker. (G) Quantification of the percentage area of IgG2a/b on individual images of pancreas sections incubated with either healthy or KPC plasma. (H) Immunofluorescence on KPC tumor sections stained for IgG2a/b (white): from left to right, native deposition in a KPC tumor, post-incubation with glycine to remove bound immunoglobulins, and post-incubation with glycine and then KPC plasma (n = 2). (I) Quantification of the percentage area of IgG2a/b on individual images of KPC tumor sections either untreated (showing native deposition in a KPC tumor), post-incubation with glycine to remove bound immunoglobulins and post-incubation with glycine and then KPC plasma. N refers to number of individual mouse tumors stained, mean and SD are also indicated. For all images scale bar is 50 μm.

