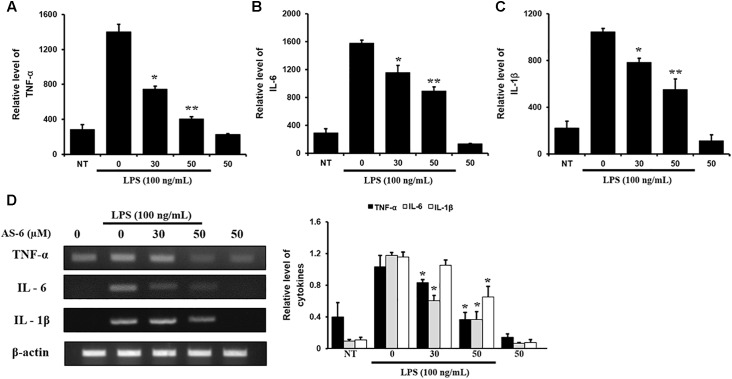
Figure 4.
Effects of AS-6 on LPS-induced TNF-α, IL-6, and IL-1β cytokine levels in macrophage cells. Macrophage cells were treated with 0–50 μM AS-6 and then co-treated with 100 ng/mL LPS for 24 h. (A–C) 0–50 μM AS-6 dose-dependently attenuated LPS-induced transcription levels and TNF-α, IL-1β, and IL-6 inflammatory cytokines using ELISA. (D) mRNA levels of cytokines levels of TNF-α, IL-6, and IL-1β were analyzed by RT-PCR. Results shown are representative of three independent experiments. Results are presented was mean ± SEM. ∗p < 0.05 and ∗∗p < 0.01 indicate significant differences from LPS treated cells. NT, no treatment; L, LPS; L+A, LPS + AS-6; A, AS-6.

