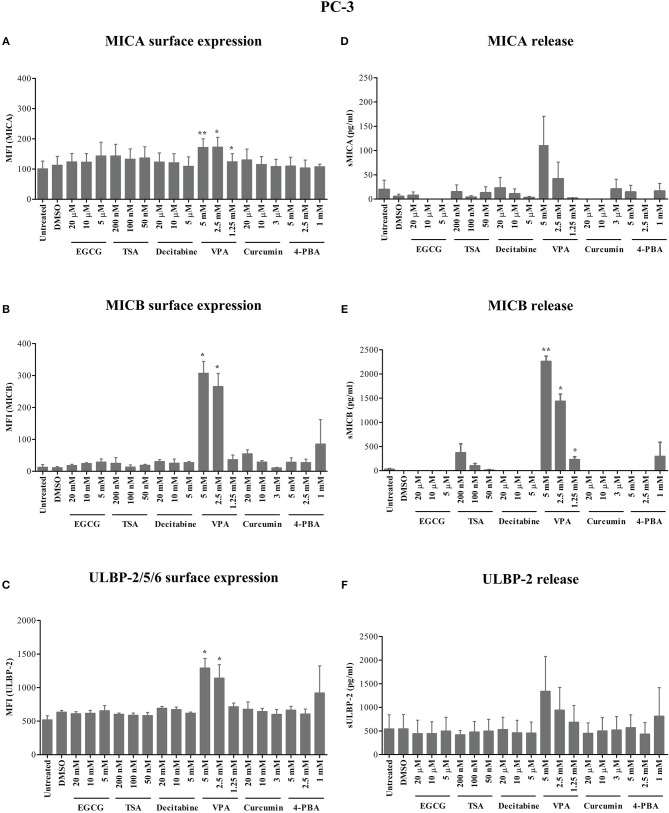
Figure 2.
Modulation of NKG2D ligand expression and release from a prostate cancer cell line by epigenetic inhibitors. (A–C) In a similar approach as shown for Panc89 cells in Figure 1, PC-3 cells were analyzed for MICA, MICB and ULBP-2/5/6 surface expression. (D–F) Culture supernatants were quantitated for respective soluble NKG2D ligand proteins using ELISA. Data are summarized as mean ± S.E. from three independent experiments and p-values for <0.05 and 0.01 in comparison to untreated or DMSO treated cells are shown as *, and **, respectively.

