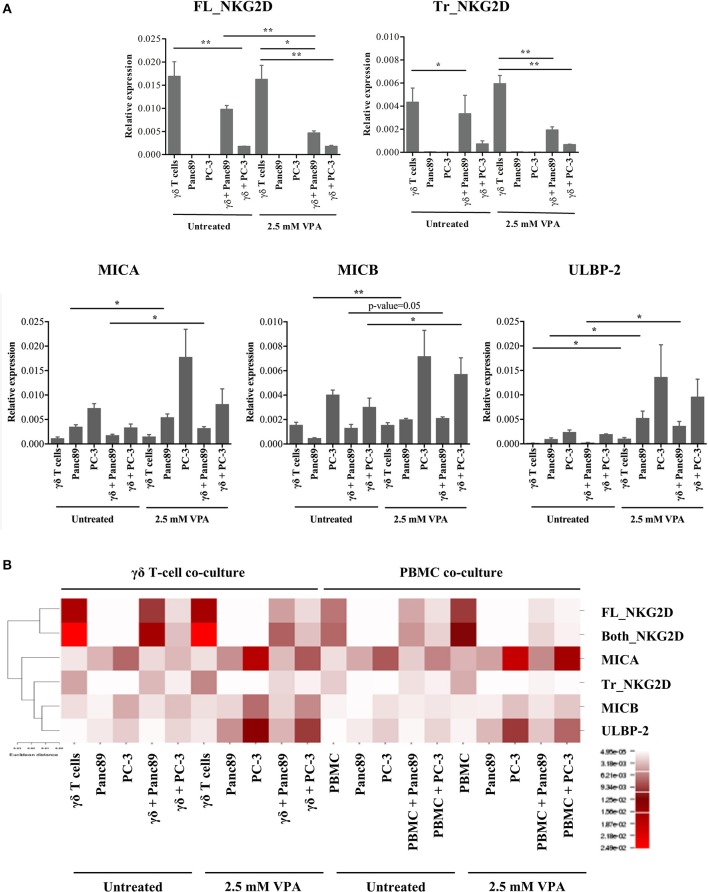
Figure 4.
VPA-mediated regulation of NKG2D receptor and ligand gene expression. (A) γδ T cells were treated with 2.5 mM VPA or left untreated and co-cultured with or without Panc89 and PC-3 cells. After 24 h, γδ T cells from co-cultures and solo-culture, or adherent tumor cells from solo-cultures (as an internal control) were harvested and analyzed for mRNA expression of full length NKG2D (FL_NKG2D), truncated NKG2D (Tr_NKG2D), MICA, MICB, and ULBP-2/5/6. mRNA levels were calculated as relative expression values compared to the mean Ct value of the housekeeping genes (β-actin, β2-microglobulin and 18S rRNA). Graphs represent mean values ± S.E. of three independent experiments with p-values < 0.01, 0.05 as **, *. (B) Based on the relative expression level, the heatmap illustrates unsupervised hierarchical clustering of respective mRNA for NKG2D receptor-ligands using Euclidian distance method with average linkage rule. Though the graph of relative expression for sequences covering both the full length and truncated NKG2D gene (Both_NKG2D, as an experimental control which includes both truncated and full-length variants) is not shown in the Figure 4A, the expression values were used for the hierarchical clustering. The color and intensity of the boxes is used to represent changes of gene expression as indicated in the color legend.

