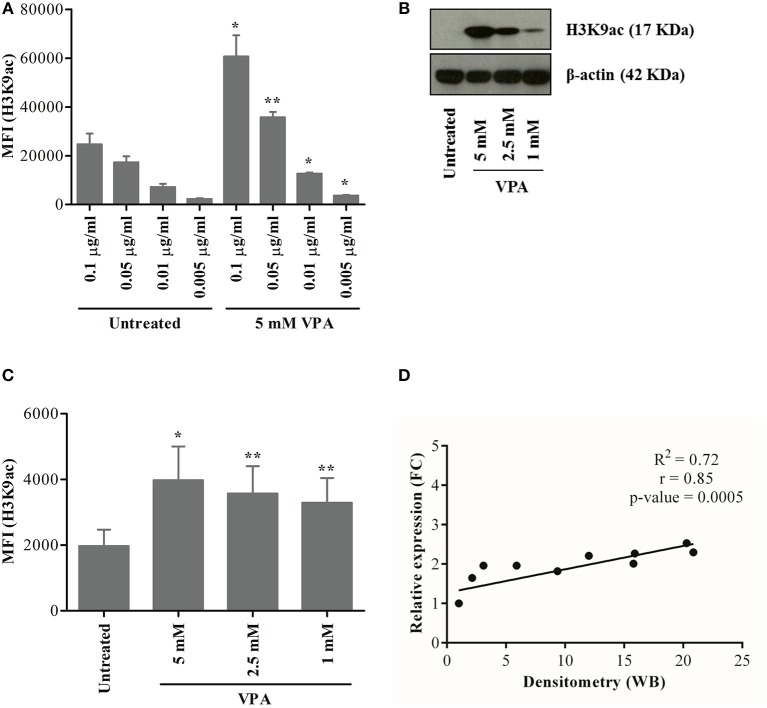
Figure 5.
Establishment of a flow cytometry-based analysis of H3K9 acetylation. γδ T cells were derived from PBMC stimulated with zoledronic acid and IL-2 for 12 days. (A) γδ T cells treated or not with 5 mM VPA were stained with titrated concentration of H3K9ac antibodies. γδ T cells were also treated with 5, 2.5, and 1 mM VPA for 24 h and harvested for analysis by western blot (B) or flow cytometry (C). For western blotting, β-actin was used as a loading control. For flow cytometry-based analysis, appropriate isotype control was used. (D) The ratio was first calculated between H3K9ac protein expression and loading control from western blot (B) and then the relative density was calculated by dividing the ratio of untreated condition by respective VPA treatment. Similarly, median fluorescence intensity (MFI) was first calculated by subtracting the MFI of isotype control from H3K9ac antibody (C) and then the relative expression was calculated by dividing MFI of untreated condition by respective VPA treatment. A correlation between relative density from western blot and relative expression from flow cytometry was calculated for statistical significance (p-value), correlation co-efficient (r), the coefficient of determination (R2) and represented using the scatter plot. Plots represented in the figure are based on values from three to five independent experiments. P-values of significance for <0.05 and 0.01 are indicated by * and **, respectively.

