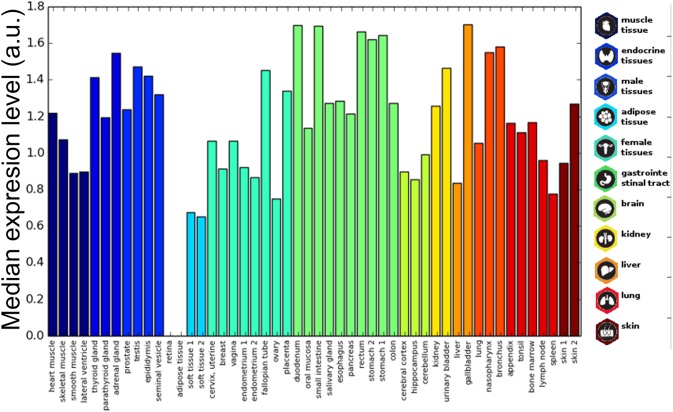
FIGURE 4.
Prion-like proteins expression in tissues. The average expression of prion-like proteins dataset is plotted for different tissues. The tissue bars are colored based on the corresponding organ/tissue. Values range from 0 to 3 corresponding to Human Protein Atlas annotation “not detected,” “low,” “medium,” and “high.”

