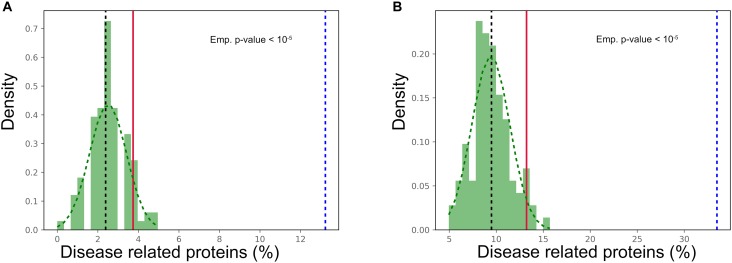
FIGURE 5.
Prion-like proteins disease association. Number of disease associations for prion-like proteins (dotted blue line) compared to 100 random sampling of the human UniProt from (A) OMIM and (B) DisGeNET databases. The median of the background sample is plotted as a black dotted line, while the red line refers to the 95 percentile of the distribution (p-value < 0.05).

