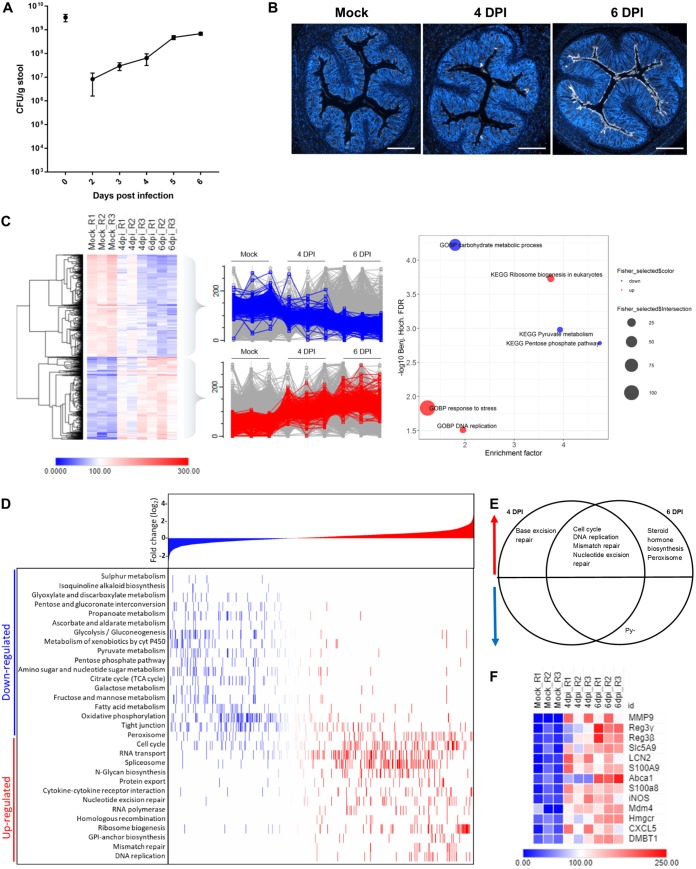
FIG 1.
Sporadic C. rodentium colonization at 4 DPI induces upregulation of the cell cycle and downregulation of metabolic processes. (A) Line graph showing average numbers of CFU/g feces with standard error of the mean bars over the time course of C. rodentium infection (n = 10). (B) Representative images of immunostaining of C. rodentium (white) and DNA (blue) on colonic sections (n = 10) from mock-infected (Mock) or infected mice at 4 DPI or 6 DPI, as indicated. Sections from 4 DPI were highly varied; thus, the image with the average level of C. rodentium staining was selected. Scale bar = 500 µm. (C) Heat map showing proteins with significantly altered abundances at 6 DPI compared to abundances in mock-infected mice and filtered for the 30% most altered proteins upon infection. Scaled abundances for 3 biological repeats of each time point are shown (R1 to R3). Profile plots show significant downregulated proteins in blue and upregulated proteins in red. The right-most plot shows relative enrichments of named KEGG and GOBP pathways. Fischer exact test FDR, <0.05. Benj. Hoch., Benjamini-Hochberg. (D) KEGG pathway enrichment analysis. Proteins are ranked according to log2 values on the x axis, with increasingly negative log2FC values on the far left (blue) to increasingly positive log2FC values during infection on the far right (red). 1D annotation enrichment of KEGG pathways during infection are highlighted in the heat map on the y axis, with the most downregulated pathways at the top to the most upregulated pathways at the bottom. FDR < 0.05; t test (n = 3). (E) Venn diagram showing pathways that are upregulated (red) or downregulated (blue) at 4 DPI, 6 DPI, or both time points of infection. (F) Heat map of selected proteins from the top 100 proteins when statistically significantly altered abundances are ranked based on the highest fold change at 6 DPI compared to abundances in mock-infected controls.

