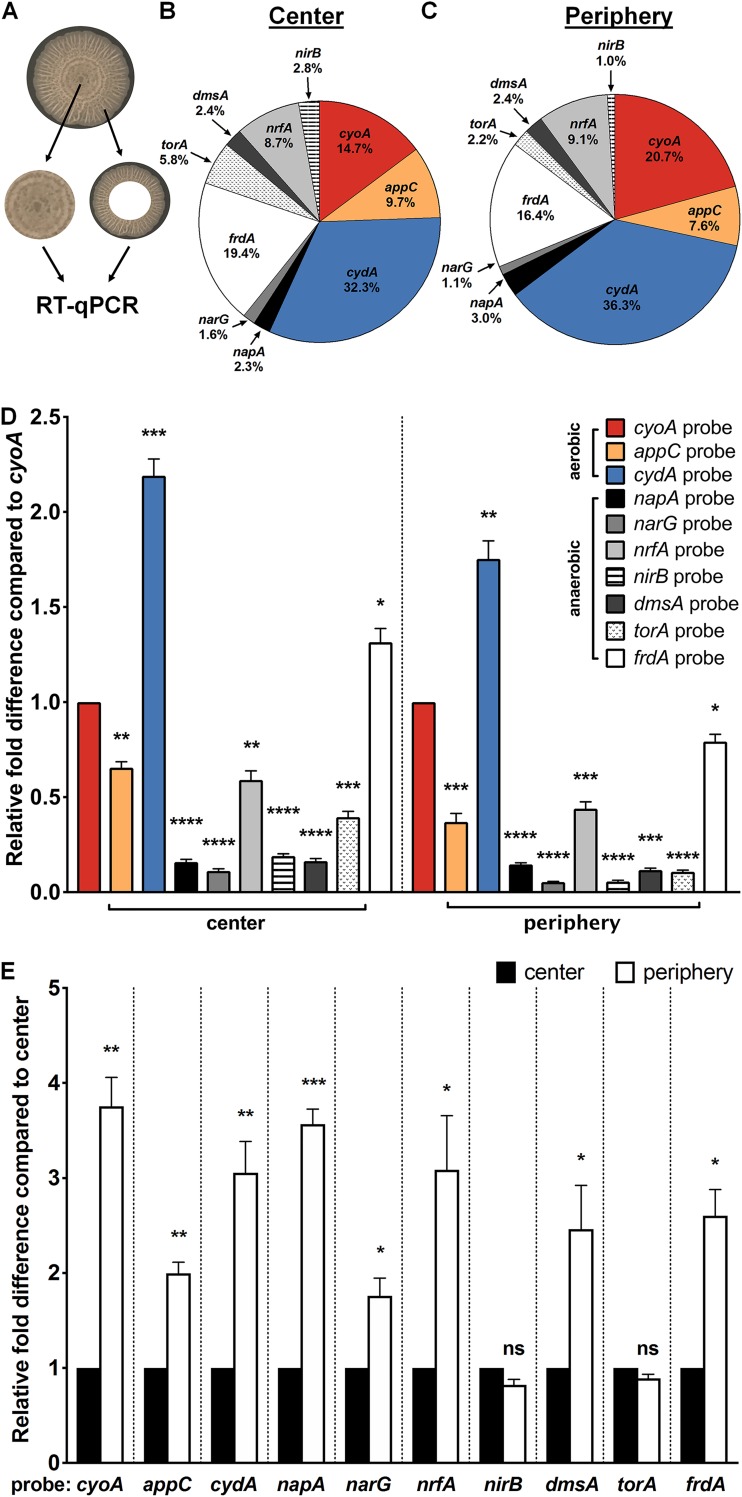
FIG 1.
Lateral expression of respiratory complexes in Escherichia coli biofilms. (A) Image of a mature colony biofilm formed by UPEC strain UTI89 on YESCA agar without supplementation of alternative terminal electron acceptors. The center and periphery of colony biofilms, including both the surface and interior of each region, were harvested and subjected to RNA extraction and RT-qPCR using probes targeting each respiratory operon present in UPEC. (B and C) Pie charts indicating the relative abundance of detected respiratory transcripts in the biofilm center (B) and periphery (C). Aerobic respiratory operons are presented in color, whereas anaerobic respiratory operons are presented in grayscale. (D) Graph depicting relative fold differences in respiratory transcript abundance in the biofilm center and periphery compared to cyoA abundance in the same region. (E) Graph depicting relative fold difference in abundance of each transcript in the biofilm periphery compared to abundance of the same transcript in the biofilm center. The graphs and pie charts depict the average from four biological replicates. Statistical analysis was performed in GraphPad Prism using a two-tailed paired t test. Data are presented as mean ± SEM. *, P < 0.05; **, P < 0.01; ***, P < 0.001; ****, P < 0.0001.

