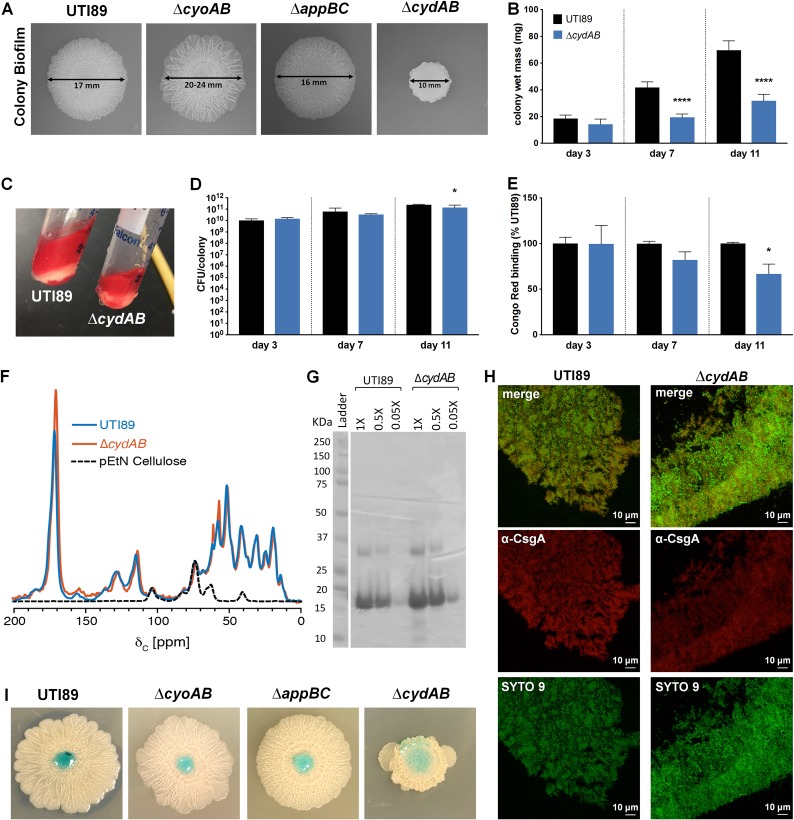
FIG 3.
Cytochrome bd organizes biofilm architecture and ECM production. (A) Colony biofilms of UTI89 and quinol oxidase mutants grown on YESCA agar for 11 days. Images are representative of at least 30 biological replicates. (B) Graph depicting wet mass of individual colony biofilms at days 3, 7, and 11 of growth. Data are the average from five biological replicates per day. Data are presented as mean ± SD. (C) Image depicting gross changes to extracellular matrix (ECM) abundance between UTI89 and ΔcydAB colony biofilms. ECM is stained red by the presence of Congo red in the growth medium. (D) CFU per colony biofilm was measured at days 3, 7, and 11 of growth. Data are presented as mean ± SD. Data are representative of five biological replicates. (E) Congo red binding as a percentage of binding in UTI89. Data are presented as mean ± SEM. (F) Solid-state NMR spectra of the ECM of UTI89 (blue), ΔcydAB strain (orange), and isolated pEtN cellulose (black). (G) SDS-PAGE gel of UTI89 and ΔcydAB ECM. ECM was treated with 98% formic acid and vacuum centrifuged prior to analysis to dissociate curli amyloid fibers. (H) Immunofluorescence images of curli (α-CsgA, red) localization in UTI89 and ΔcydAB colony biofilm cryosections. (I) Colored water droplets were added to the top of day 11 colony biofilms to probe biofilm barrier function. All statistical analysis was performed in GraphPad Prism using a two-tailed unpaired t test. *, P < 0.05; **, P < 0.01; ***, P < 0.001; ****, P < 0.0001.

