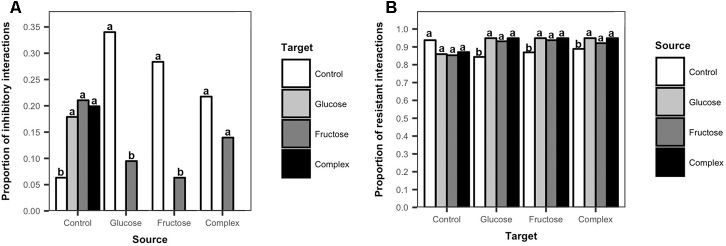
FIGURE 4.
Frequency of inhibitory and resistant interactions among Streptomyces isolates from carbon-amended and non-amended soils. Each bar represents the mean proportion of inhibitory interactions among source Streptomyces isolates (n = 10) that were inhibitory against target Streptomyces isolates (n = 10) from different treatments (A), or the mean proportion of resistant interactions among target Streptomyces isolates (n = 10) that resisted inhibition by source Streptomyces isolates (n = 10) (B). Inhibitory interactions were determined by the presence and size of complete inhibition zones (>2 mm) representing the lack of growth of a target isolate in association with a source isolate on agar plates. Resistant interactions were determined by the presence and size of incomplete inhibition zones (<2 mm) representing the growth of a target isolate and the lack of inhibition by a source isolate on agar plates. Different letters above the bars indicate significant differences among treatments of source isolates (Figure 4A) and within treatments of target isolates (Figure 4B). Bars sharing at least one letter are not significantly different from each other (ANOVA and LSD test, p < 0.05).

