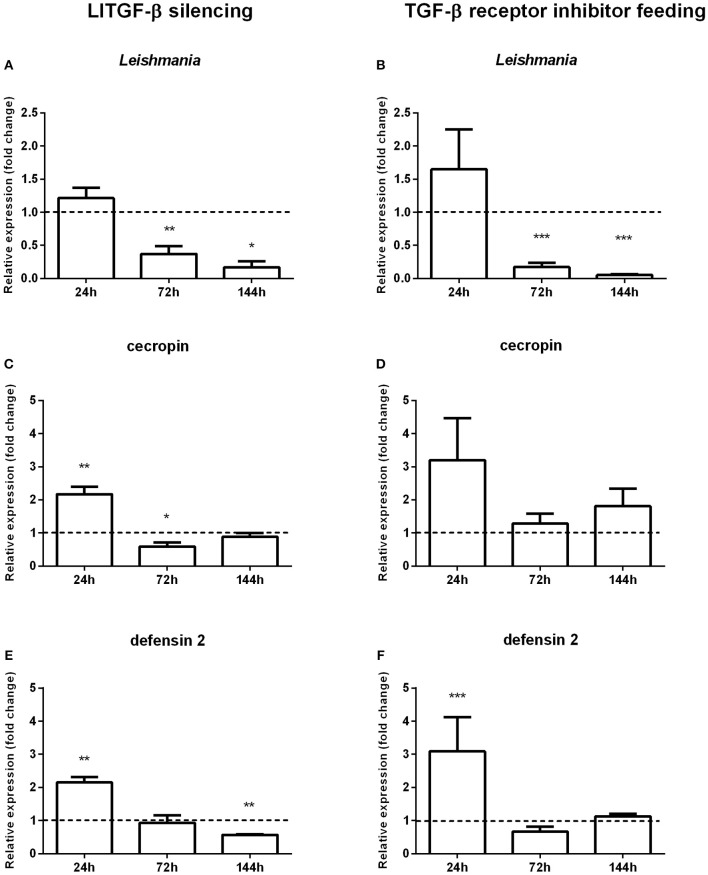
Figure 3.
Gene expression in sand flies infected by L. i. chagasi after abrogation of the LlTGF-β signaling pathway. (A,C,E) Gene expression of LlTGF-β silenced insects. (B,D,F) Gene expression of insects fed with TGF-β receptor inhibitor. (A,B) Quantification of L. i. chagasi in sand flies. (C,D) Relative expression of cecropin. (E,F) Relative expression of defensin 2. Samples were collected at 24, 72, and 144 h post infection. Dotted lines indicate gene expression of β-galactosidase dsRNA injected (A,C,E) or DMSO fed flies (B,D,F) control groups, or. Both test and control groups were infected by L. i. chagasi. Comparisons were done between silenced vs. non-silenced, or inhibitor treated vs. non-treated sand fly groups. Bars represent mean with standard error of fold change in gene expression relative to control groups of 3 independent experiments. Significant differences were evaluated by t-test and Mann–Whitney post-test (*p < 0.05; **p < 0.01; ***p < 0.001).

