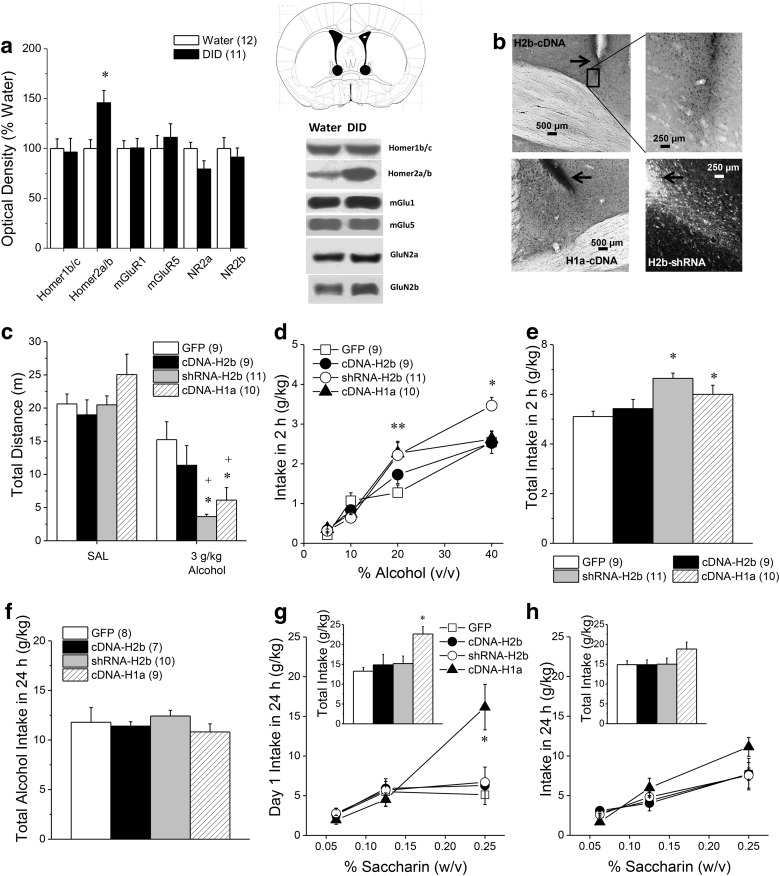
Figure 1.
Disruption of Homer2 scaffolding within the BNST promotes behavioral sensitivity to high-dose alcohol. a, Relative to water-drinking controls (Water), mice with a 30 d history of 20% (v/v) alcohol intake under 2 h DID procedures exhibited elevated protein expression of Homer2a/b within BNST, but no change in Homer1b/c, mGlu1/5, or GluN2a/b levels. *p < 0.05 versus water (t tests). Representative immunoblots are also shown for the proteins examined and a diagram depicting the tissue dissection within the anterior-dorsal BNST. b, Representative micrographs of immunostaining of the HA tag within the BNST of B6 mice infused with an AAV carrying Homer2b cDNA (cDNA-H2b) or with an AAV carrying Homer1a cDNA (cDNA-H1a), as well as immunofluorescence of the GFP tag in mice infused with an AAV carrying an shRNA against Homer2b (shRNA-H2b). Arrows in b depict the tip of the microinjector. c, Intra-BNST infusion of shRNA-H2b or cDNA-H1a augmented the motor-impairing effects of an acute intraperitoneal injection of 3 g/kg alcohol, whereas no saline-alcohol differences in locomotion were observed in GFP or cDNA-H2b mice. d, Examination of the alcohol dose-intake function under 2 h DID procedures revealed a shift upward in shRNA-H2b and cDNA-H1a mice, relative to GFP controls, with both shRNA-H2b and cDNA-H1a elevating the intake of 20% alcohol and shRNA-H2b elevating the intake of 40% alcohol. e, Thus, the average total alcohol intake under 2 h DID procedures was greater in shRNA-H2b and cDNA-H1a mice versus controls. f, In contrast, intra-BNST AAV infusion did not influence the average total alcohol intake when alcohol was made continuously available in the home cage. Sample sizes are for a–f are indicated in parentheses in their corresponding panels. g, However, when saccharin was substituted for alcohol, the cDNA-H1a mice exhibited a shift upward in the saccharin dose-intake function (0.0625, 0.125, 0.25%), as well as greater total saccharin intake (inset), when assessed on Day 1 of continuous access procedures. h, However, intra-BNST AAV infusion did not influence significantly the dose–response function for the average saccharin intake when the data from the entire 7 d drinking period was considered, nor did AAV infusion alter total saccharin intake (inset). The sample sizes for g and h are indicated in parentheses in f because the same animals were tested for alcohol and saccharin consumption under continuous-access procedures. *p < 0.05 versus GFP; **both groups p < 0.05 versus GFP (LSD post hoc tests), +p < 0.05 versus saline (t tests).

