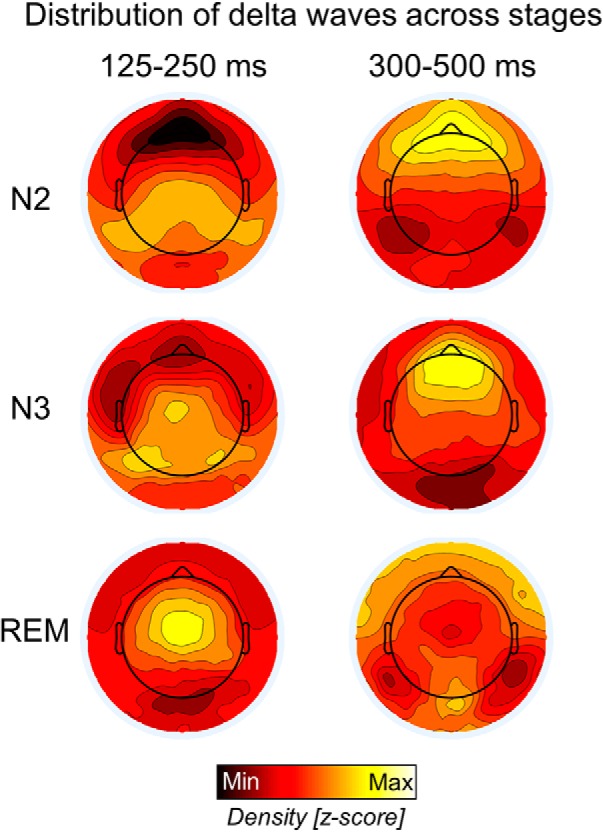
Figure 10.

Relative topographic distribution of EEG waves with durations of 125–250 ms (left) and 300–500 ms (right) in N2, N3, and REM sleep. Density values were z-scored to facilitate comparison across stages. The strong frontal slow-wave activity in NREM sleep likely masks the smaller delta waves in posterior regions.
