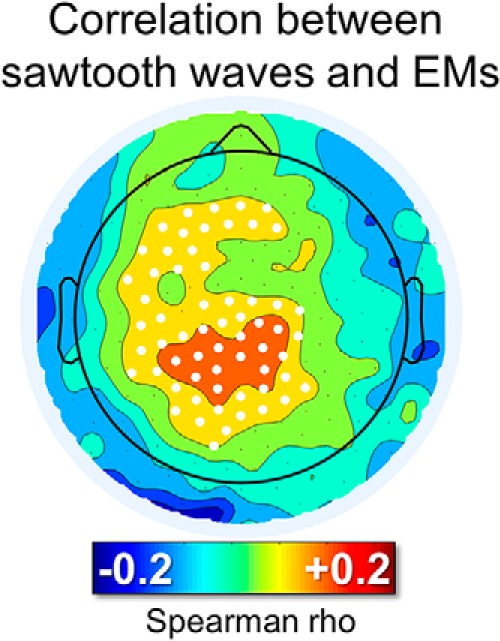
Figure 5.

Correlation between the number of sawtooth waves preceding rapid EMs and the number of subsequent rapid EMs. For each isolated group of EMs, the burst of the 125–250 ms half-waves (amplitude > 10 μV, interwave distance < 1 s) closest to the beginning of the first EM (maximum distance < 600 ms) was identified. White dots mark significant effects at the group level (p < 0.05, corrected).
