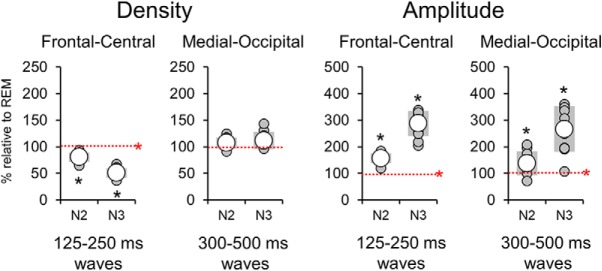
Figure 9.
Relative variations in the density and amplitude of frontal-central and medial-occipital delta waves in N2 and N3 with respect to REM sleep. The dashed red line corresponds to the level observed in REM sleep (100%). Asterisk denotes significant effects at p < 0.05 (red for Friedman test for stage-effect, black for post hoc Wilcoxon signed rank tests).

