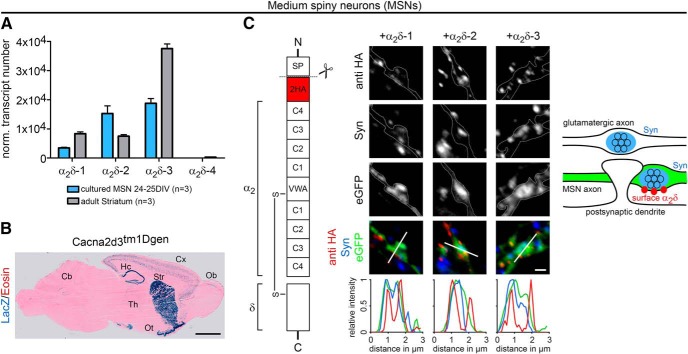
Figure 6.
Striatum and cultured MSNs express three neuronal α2δ subunits. A, Absolute qRT-PCR analysis revealed a stable expression of α2δ-1, α2δ-2, and α2δ-3 in adult mouse striatum and monocultured MSNs (24–25 DIV). Although α2δ-3 was the dominant isoform in striatal tissue, mRNA levels for α2δ-2 and α2δ-3 were similarly abundant in cultured MSNs. Error bars indicate mean ± SEM. Data from three independent culture/tissue preparations are shown. B, β-galactosidase staining of sagittal cryosections of α2δ-3 knock-out mice carrying a LacZ cassette revealed intense labeling of striatum (Str), hippocampus (Hc), and olfactory tubercle (Ot). Lower expression was detected in the cortex (Cx), thalamus (Th), olfactory bulb (Ob), and parts of the cerebellum (Cb). C, Schematic representation of the epitope-tagged α2δ subunits depicting the position of the extracellular 2HA tag inserted downstream of the signal peptide (SP), cache domains (C1–C4), and VWA (van Willebrand factor type A). Cultured MSNs were transfected with HA-tagged α2δ subunits together with soluble eGFP and live labeled with an antibody against the HA epitope at 24 DIV. All α2δ isoforms are expressed at the surface of presynaptic boutons, which is also shown by line scan analysis of α2δ-1, α2δ-2, and α2δ-3 (red) in relation to synapsin (blue) and eGFP (green). The sketch summarizes the observed labeling patterns. Representative images of three (B) and one (C) independent preparation(s) are shown. Statistics: A, ANOVA on log10-transformed data with Holm–Sidak post hoc analysis: cultured MSNs: F(3,8) = 460, p < 0.001; post hoc: p < 0.001 between all α2δ subunits except α2δ-2 vs α2δ-3 (p = 0.34); striatum: F(3,8) = 891, p < 0.001; post hoc: p < 0.001 between all α2δ subunits except α2δ-1 vs α2δ-2 (p = 0.30). Scale bars, 2 mm (B) and 1 μm (C).

