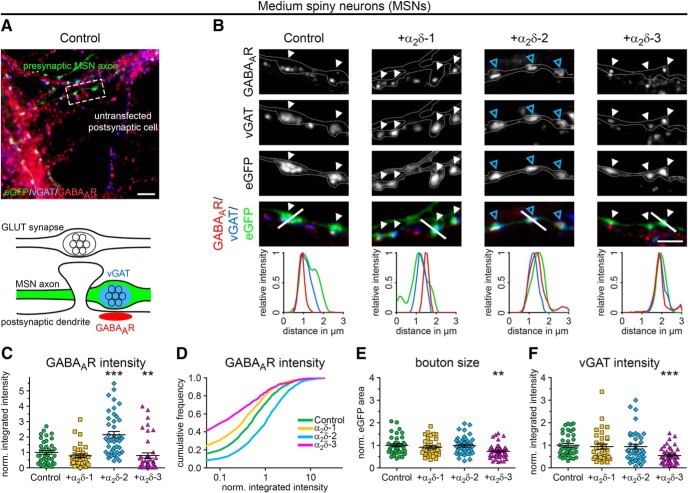
Figure 8.
Presynaptic expression of α2δ-2 induces upregulation of postsynaptic GABAARs in MSNs. A, B, Representative immunofluorescence micrographs of cultured MSNs cotransfected with distinct α2δ subunits and soluble eGFP. Transfected neurons (21–28 DIV) were immunolabeled for vGAT and the GABAAR. Colocalization of fluorescence signals within eGFP-filled axonal varicosities (arrowheads, axons are outlined with dashed lines) was analyzed using line scans. A, GABAergic synapses transfected with eGFP only (control) show matched presynaptic vGAT and postsynaptic GABAAR immunoreactivity (summarized in sketch). B, Similar to control, postsynaptic GABAARs were localized opposite vGAT-positive presynaptic terminals expressing individual α2δ isoforms (see also colocalization in line scans). Most importantly, GABAAR clusters were larger and more intense opposite synaptic boutons expressing α2δ-2 (blue arrowheads). C–F, Quantitative analysis of GABAAR fluorescence intensity (C), cumulative frequency distribution of GABAAR fluorescence intensity (D), bouton size (E), and vGAT fluorescence intensity (F). Values for individual cells (dots) and means (lines) ± SEM are shown. Values were normalized to the control within each culture preparation. Data from four independent culture preparations and 34–42 cells were analyzed in each condition. Statistics: ANOVA on log10-transformed data with Holm–Sidak post hoc analysis: C, F(3,152) = 17.6, p < 0.001; post hoc: ***p < 0.001 between α2δ-2 and control, ***p < 0.001 between α2δ-2 and α2δ-1/α2δ-3, **p = 0.004 between control and α2δ-3, p = 0.2 between control and α2δ-1; E, F(3,152) = 5.1, p < 0.01; post hoc: **p < 0.01 between α2δ-3 and control/α2δ-2, p = 0.08 between α2δ-3 and α2δ-1; F, F(3,152) = 8.0, p < 0.001; post hoc: ***p < 0.001 between α2δ-3 and control, **p < 0.01 between α2δ-3 and α2δ-1/α2δ-2. Asterisks in graphs indicate the significant difference compared with control. Scale bars, 10 μm (A) and 3 μm (B).

