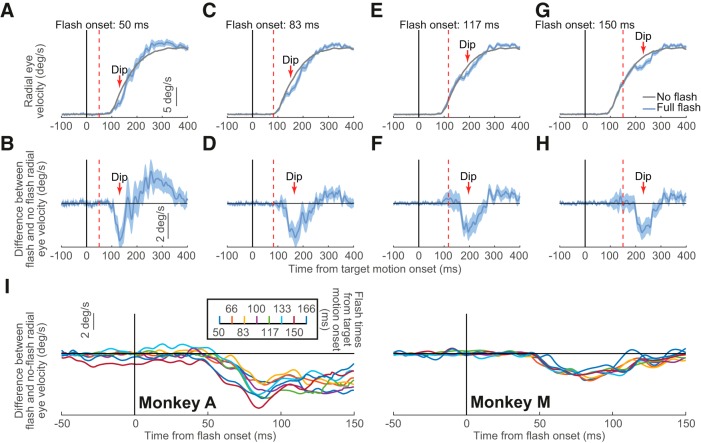
Figure 2.
Transient disruption of open-loop smooth pursuit initiation. A, We plotted radial eye velocity from Monkey M in Experiment 1 when no flashes were presented (gray) and when full flashes were presented 50 ms after target motion onset (light blue). There was a transient dip in eye velocity relative to the gray curve starting ∼50 ms after flash onset. B, Difference in eye velocity between flash and no-flash trials from A. The flash-induced dip in the difference curve is clearly visible. C, D, Same as A and B but for flashes occurring 83 ms after target motion onset. In this case, the transient disruption in open-loop pursuit initiation was slightly delayed relative to A and B because of the slight delay in flash onset time. E, F, Same as A and B but for flashes 117 ms after target motion onset. G, H, Same as A and B but for flashes after 150 ms from target motion onset. I, In all cases and for both monkeys, the disruption was always aligned on flash onset. We plotted eye velocity difference curves as in B, but now aligning the data on flash onset. The different colors denote different flash onset times relative to target motion onset. Regardless of flash time, the velocity difference curves always showed a dip ∼50 ms after flash onset. A series of one sample t tests against zero showed p < 0.05 (Bonferroni corrected) for all flash times for both monkeys (with the exception of flash time 83.33 and 125 in Monkey A). Error bars in all panels denote 95% confidence intervals. After saccade removal (Materials and Methods), trial numbers for the 15 flash delays in the full-flash condition were 8–28 (average: 21.5) and 22–72 (average: 49) in Monkeys A and M, respectively.

