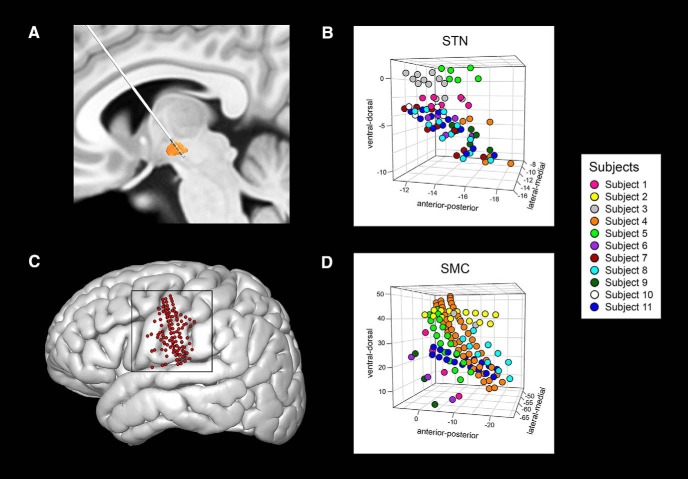
Figure 2.
Location of recording sites in the MNI-defined space. A, Example trajectory of the DBS lead through the left STN shown on the DISTAL atlas by Ewert et al. (2018). B, MNI-defined coordinates (in millimeters) of recording sites in the STN plotted for all subjects in 3D space. C, Reconstructed locations of all ECoG electrodes in the sensorimotor cortex that were included in the study (n = 125), coregistered, and plotted on the cortical surface of the MNI brain space. D, MNI-defined coordinates (in millimeters) of the ECoG contacts on the sensorimotor cortex plotted for all subjects in 3D space. In B and D, each subject's electrodes are mapped with a different color.

