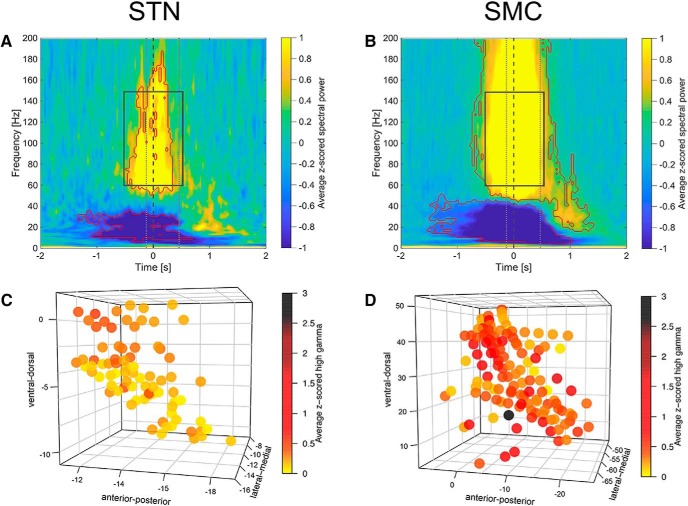
Figure 3.
STN and sensorimotor cortex (SMC) show speech-production-related time–frequency modulations. A, B, Grand average of STN (A) and SMC (B) oscillatory activity (average z-scored spectral power) across all recording sites and all trials aligned to vowel onset (time = 0 s, gray dashed vertical line). Significant modulations compared with baseline are marked in red contour (Wilcoxon's signed-rank test, p < 0.05, FDR corrected). Average speech production onsets and offsets are marked with gray dotted vertical lines. Rectangles with gray solid lines mark the time window (±500 ms from vowel onset) for the analysis of speech production-related high-gamma (60–150 Hz) activity. C, D, z-scored high-gamma (60–150 Hz) power averaged for the 1 s time window (±500 ms from vowel onset) plotted in 3D space for each subject's STN (C) and SMC (D) recording site. The location of recoding sites is provided in MNI coordinates.

