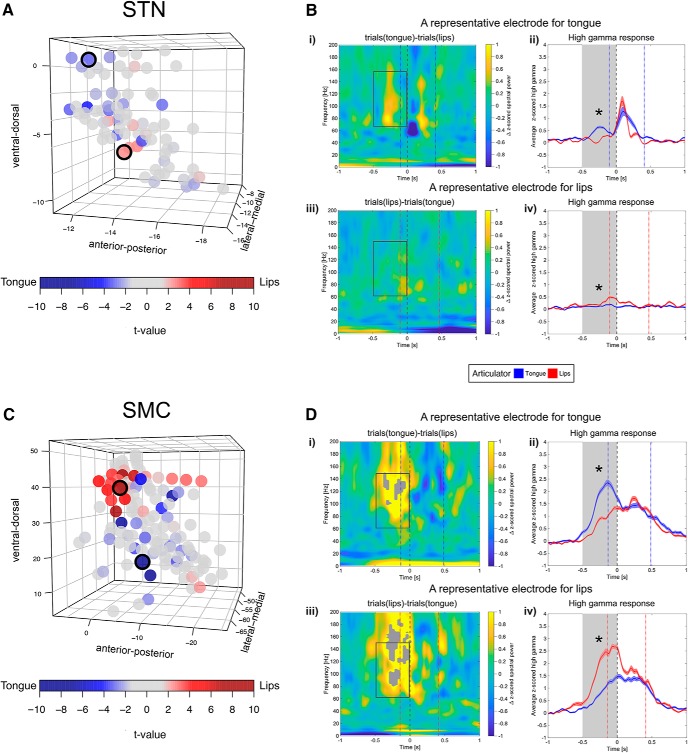
Figure 4.
Spatial distribution of tongue- and lip-preferred articulatory activity in the MNI-defined STN space and sensorimotor cortex (SMC). A, C, Outcome of a series of t tests comparing z-scored high-gamma power (averaged for a 500-ms-long time window before vowel onset) during articulation of tongue consonants versus lip consonants for each STN (A) and SMC (C) recording site. Opacity of the circles varies with the magnitude of the t-value: negative t-values (in blue shades) suggest a greater response to tongue; positive t-values (in red shades) suggest a greater response to lips (Welch's two-sample t test, p < 0.05). Note that the obtained t-values for the SMC sites differed significantly along the ventral–dorsal and lateral–medial axes (Spearman's rank-order correlation test, p < 0.01), suggesting articulator-discriminative somatotopy. Circles with black outline mark representative sites for tongue and lips, the articulatory activity of which is plotted on the right. B, D, Examples of representative tongue-preferred and lips-preferred sites for STN (B) and SMC (D). A subtraction time–frequency representation is shown for the tongue-preferred site after time–frequency representation for all trials with lip consonants is subtracted from time–frequency representation for all trials with tongue consonants (i) and for the lip-preferred site after time–frequency representation for all trials with tongue consonants is subtracted from time–frequency representation for all trials with lip consonants (iii). Gray-filled contours mark significant time–frequency differences between the two conditions (Wilcoxon's rank-sum test, p < 0.05, FDR corrected). Rectangles with gray solid lines mark the time window (from 500 ms before vowel onset until vowel onset) for the analysis of articulator-specific high-gamma (60–150 Hz) activity. Differences in averaged z-scored high-gamma power elicited by trials with the tongue articulation versus the lip articulation are shown for tongue-specific (ii) and lip-specific (iv) sites (significant differences are marked with asterisks, Welch's two-sample t test, p < 0.05). Gray bands mark the time window (from 500 ms before vowel onset until vowel onset) across which high-gamma power was averaged for the analysis of articulator-specific activity. Throughout i–iv, gray dashed vertical line represents vowel onset (time = 0 s). Dotted vertical lines represent spoken response onsets and offsets for trials with tongue consonants (blue) and trials with lip consonants (red).

