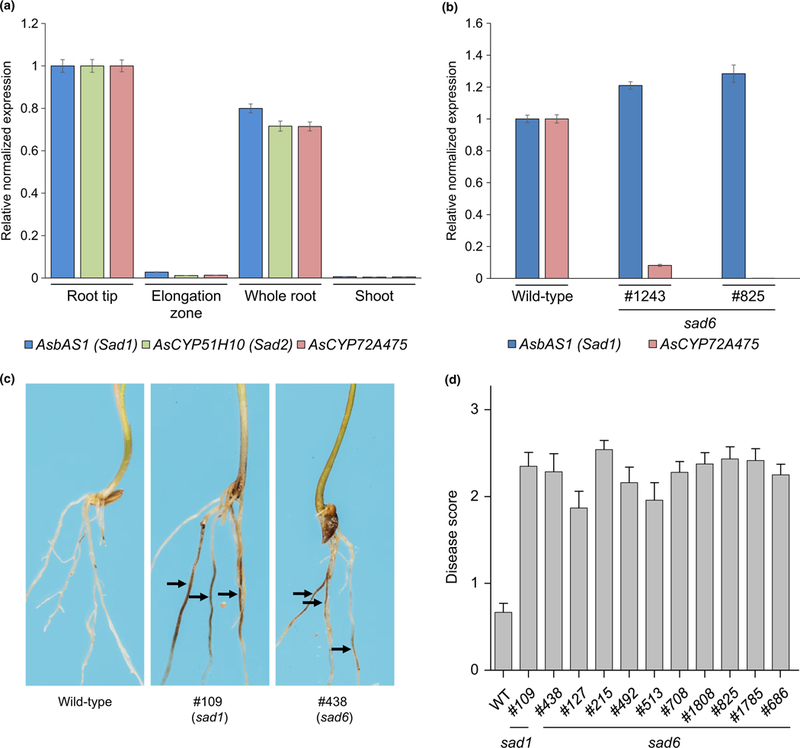
Fig. 5.

Analysis of Ascyp72a475 (sad6) mutants. (a) Quantitative reverse transcription polymerase chain reaction (qRT-PCR) analysis of transcript abundances of AsbAS1/Sad1, AsCYP51H10/Sad2 and AsCYP72A475 in RNA extracted from 3-d-old Avena strigosa seedlings. (b) qRT-PCR analysis of AsCYP72A475 transcript abundances in RNA extracted from roots of wild-type and sad6 mutant lines. Expression levels are shown relative to the wildtype. All qPCR data transcript abundances were normalized to those for the elongation factor 1 (EF1-α) housekeeping gene, using the ΔΔCq method (Livak & Schmittgen, 2001). Values are means ± SE (three technical replicates). (c) Representative roots of wild-type, sad1 and sad6 A. strigosa lines following inoculation with the take-all fungus (Gaeumannomyces graminis var. tritici strain T5). Roots were scored based on presence and extent of lesions (arrows) as previously described (Papadopoulou et al., 1999). (d) Disease scores for a suite of sad6 mutant lines (Supporting Information Fig. S7a) compared with those of the wild-type (S75) and a susceptible sad1 mutant line (#109). The bars represent mean disease scores (21–25 seedlings per line). Error bars represent the SE of the mean.
