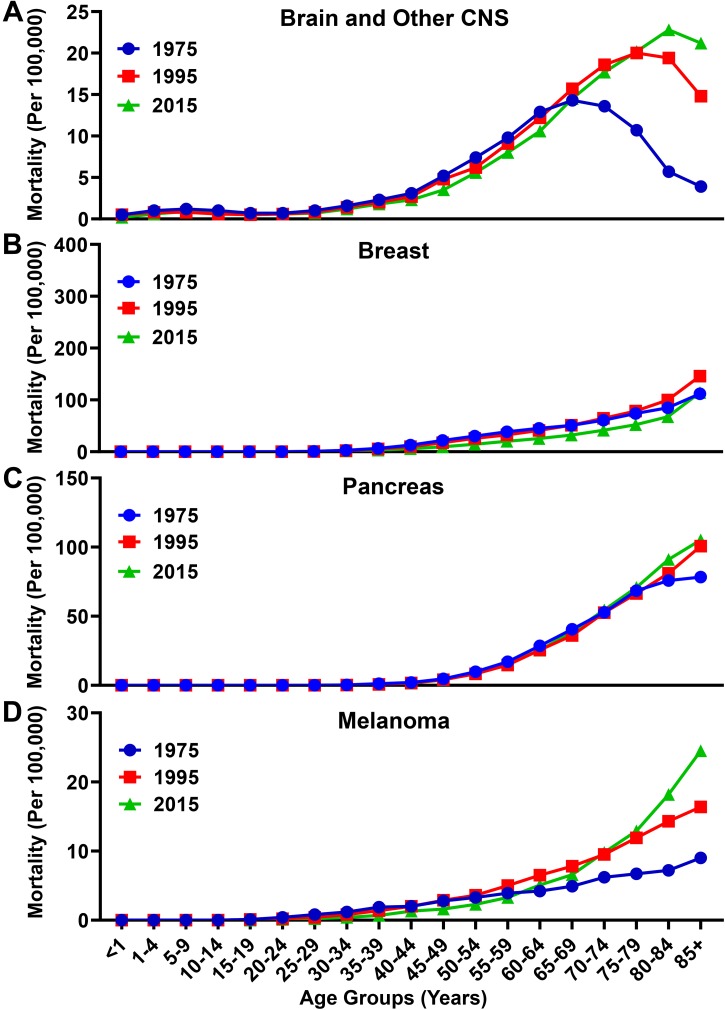
FIGURE 4.
Mortality rate for brain, breast, pancreatic, and melanoma malignancies over time. Mortality rates for (A) brain and other CNS, (B) breast, (C) pancreatic, and (D) melanoma malignancies analyzed from the SEER database for the years 1975, 1995, and 2015. Rates defined as number of deaths divided by the population in each age category multiplied by 100,000 people (per 100,000).

