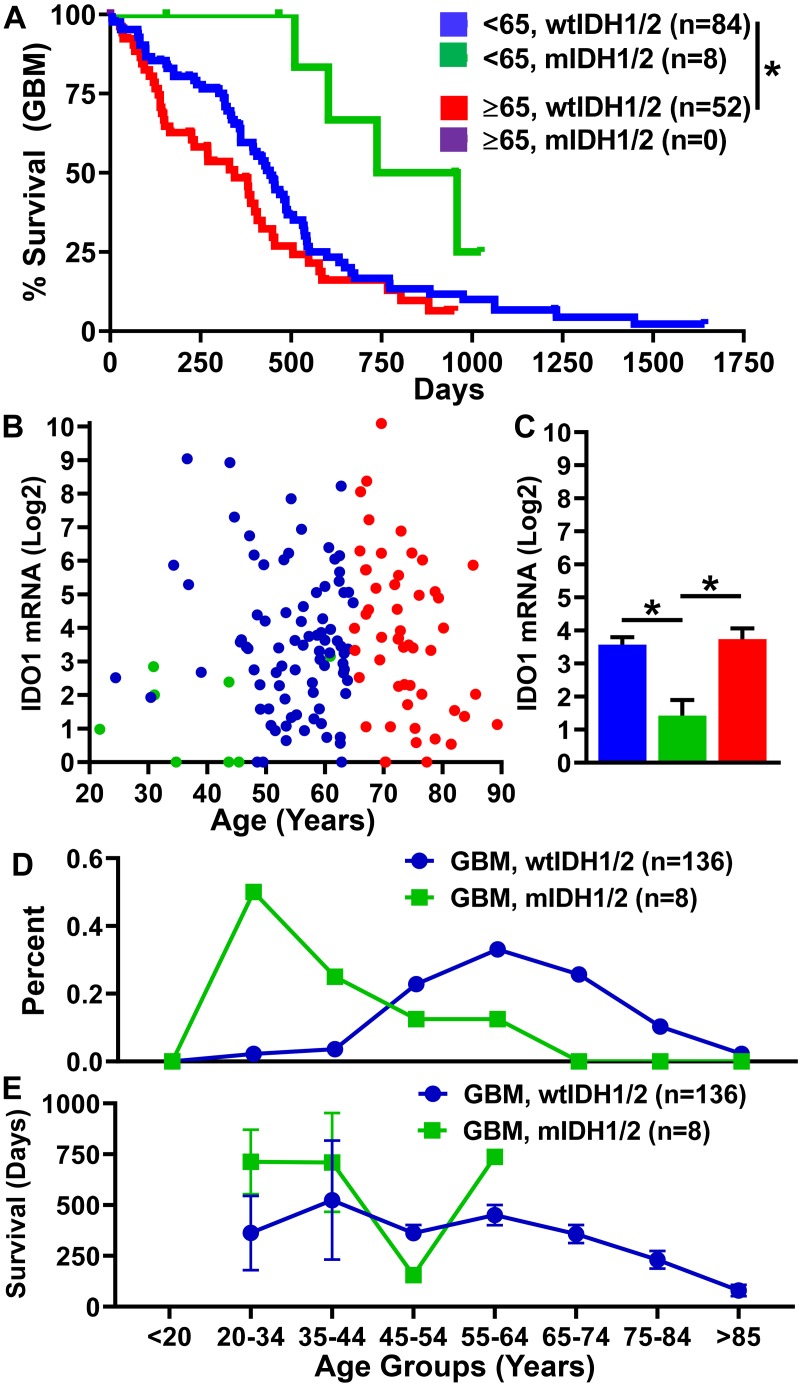
FIGURE 7.
Prognosis is worse for individuals with GBM ≥65. Analysis of GBM data for individuals with corresponding patient data, gene expression (HiSeq) data, and a reported mIDH1/2 status from the TCGA. (A) Survival data of individuals with wild-type IDH1/2 <65 (n = 84), ≥65 (n = 52), and those with mIDH1/2 (n = 8). IDO1 gene expression (B) dot plot and (C) bar graph of individuals with wild-type IDH1/2 <65 (blue), ≥65 (red), and those with mIDH1/2 (green). (D) The percentage of GBM diagnoses within each age category for individuals with wtIDH1/2 (blue) and mIDH1/2 (green). (E) Survival time in days of individuals diagnosed in each age category. ∗P < 0.05.

