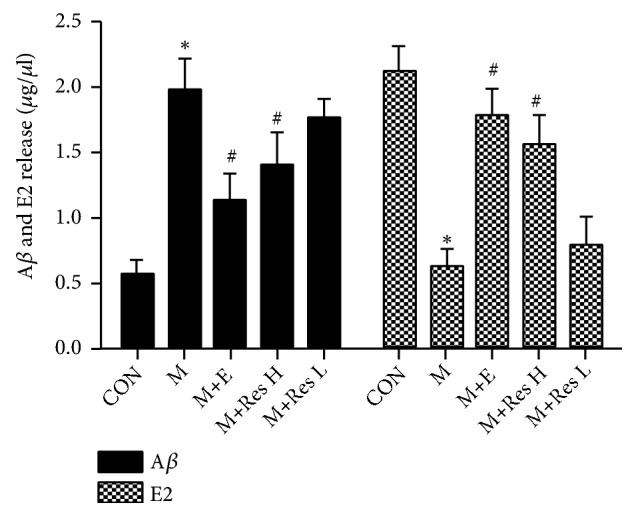
Figure 6.

Changes in the expression of Aβ and E2 in the brain tissue from each group. Note: compared with the CON group, ∗P <0 .01; compared with the model group, #P <0.01.

Changes in the expression of Aβ and E2 in the brain tissue from each group. Note: compared with the CON group, ∗P <0 .01; compared with the model group, #P <0.01.