Figure 2.

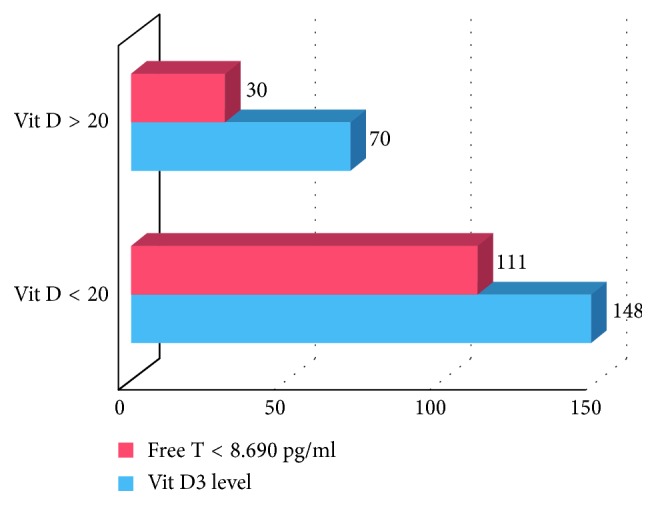
Division of study population in two groups based on vitamin D3 levels (n = 218) and prevalence of FT levels in the two subgroups (FT = free testosterone).

Division of study population in two groups based on vitamin D3 levels (n = 218) and prevalence of FT levels in the two subgroups (FT = free testosterone).