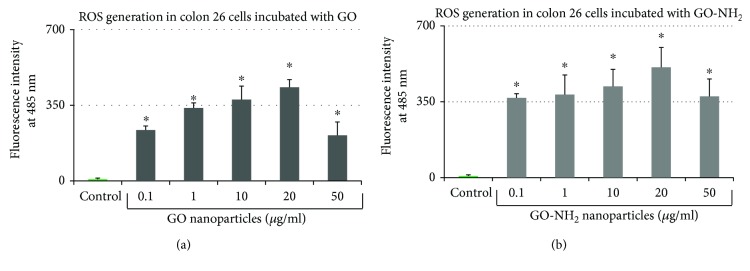
Figure 5.
ROS production in Colon 26 cells after treatment with GO nanoparticles: (a) ROS production after 24-hour incubation in increasing concentrations of pristine GO; (b) ROS production after 24-hour incubation in increasing concentrations of aminated GO-NH2 (asterisks ∗ denote p < 0.05, respectively, when the tested probes are compared to untreated cells).

