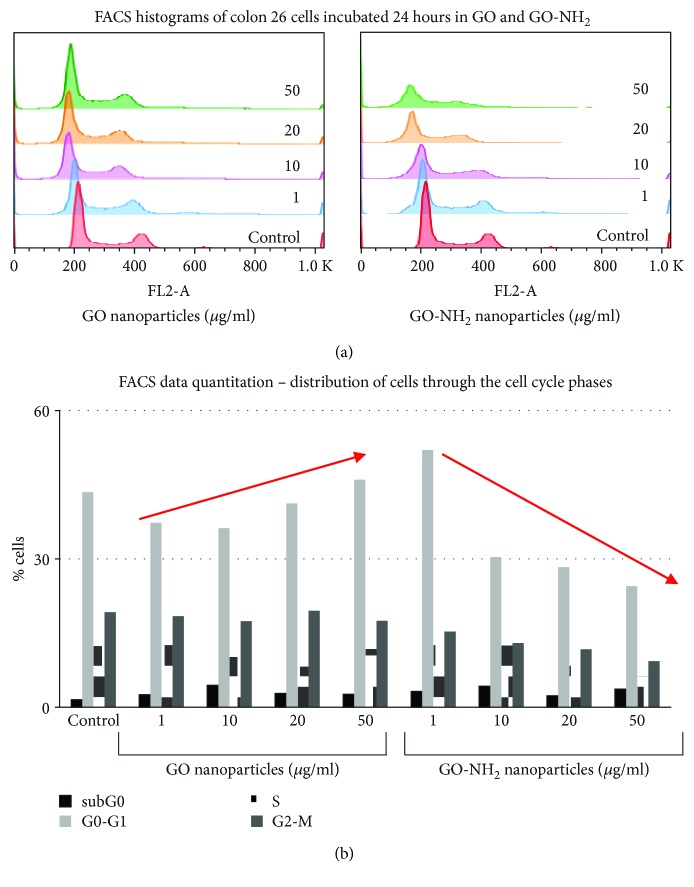
Figure 8.
FACS analysis of Colon 26 cells cultivated for 24 hours in the presence of increasing concentrations of pristine and aminated GO nanoparticles: (a) histograms of Colon 26 cells representing the percentage of cells progressing through the phases of the cell cycle after incubation with GO and GO-NH2 nanoparticles; (b) representation of FACS data quantitation for colon 26 cells. Data are represented as mean, where n = 100 000. The red arrows show the trend in the distribution of cells in the G0-G1 phase of the cell cycle for both GO and GO-NH2 nanoparticles.

