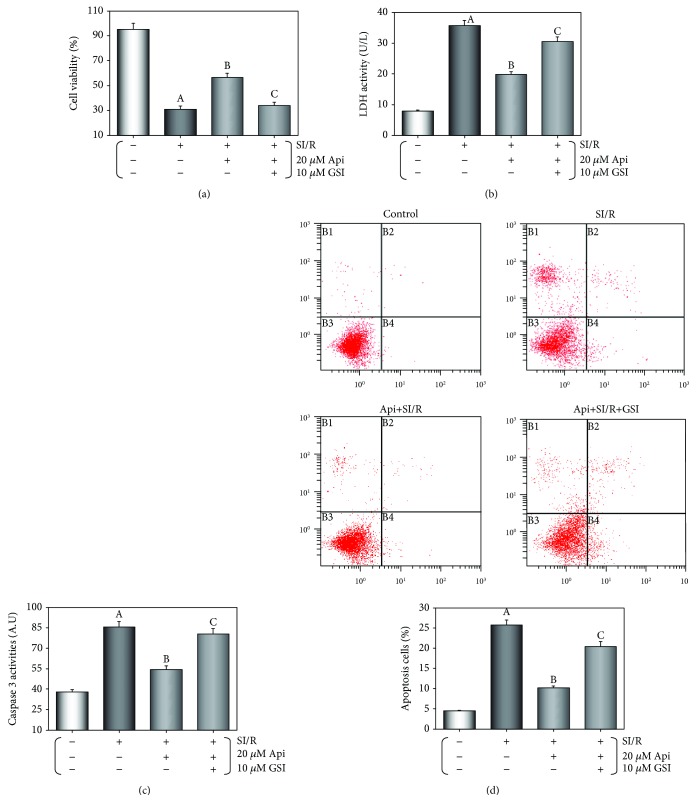
Figure 6.
GSI abolished the protective effects of Api pretreatment on cardiomyocytes. (a) Cell viability was evaluated using the MTT assay. Column bar graphs showing LDH activity (b) and caspase-3 activity (c). (d) Representative flow cytometric dot plots (x-axis and y-axis representing Annexin V and PI staining, respectively) and the quantification of apoptotic cell population. Values are presented as mean ± S.E.M. of 8 individual experiments. (a) p < 0.01 vs. control group; (b) p < 0.01 vs. SI/R group; (c) p < 0.01 vs. Api + SI/R group.

