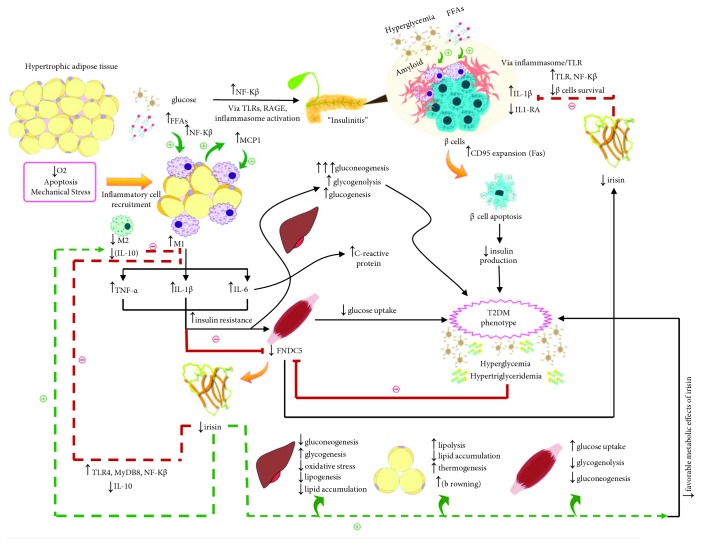
Figure 4.
Possible irisin-inflammatory cross talk in overt T2DM and exacerbation of metabolic derangements due to hypoirisinemia. Dotted lines indicate the theoretical compensatory effects of higher irisin levels in context of obesity, which may be impaired in patients with T2DM who have decreased levels of irisin. Continuous lines indicate an effect that could be observed in context of T2DM. Green lines indicate stimulation and red lines indicate inhibition. FFAs = free fatty acids; FNDC5 = fibonectin type III domain-containing protein 5; IL-1RA = interleukin-1 receptor antagonist; IL-1β = interleukin-1β; IL-6 = interleukin-6; IL-10 = interleukin-10; LPS = lipopolysaccharide; M1 = classically activated (proinflammatory) macrophage; M2 = alternatively activated (anti-inflammatory) macrophage; MCP1 = monocyte chemoattractant protein 1; MyD88 = myeloid differentiation primary response 88; NF-κB = nuclear factor kappa B; TLR = toll-like receptor; RAGE = receptor for advanced glycation end products; T2DM = type 2 diabetes mellitus; TNF-α = tumor necrosis factor-alpha.

