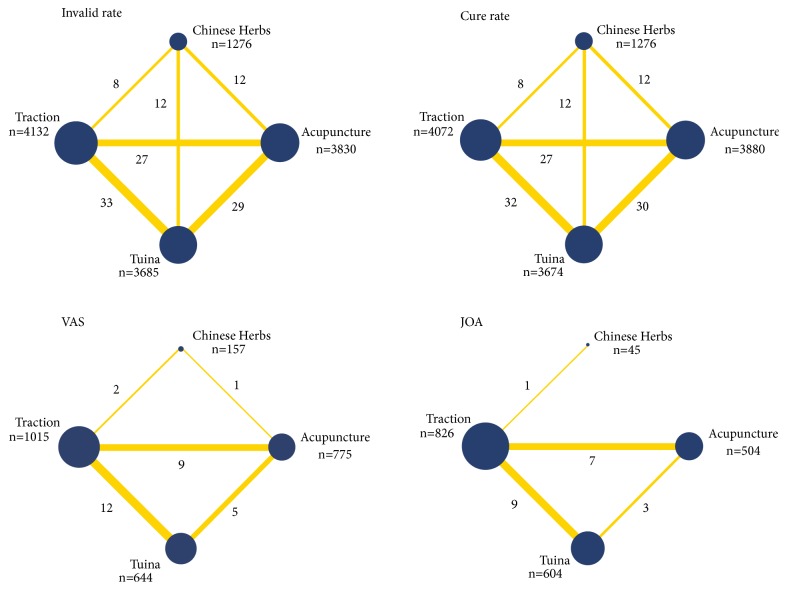
Figure 2.
Network of treatment comparisons (Note: width of the lines is proportional to the number of trials comparing every pair of treatments. Size of each circle is proportional to the sample size of interventions. For example, in invalid rate, “8” represents the number of comparisons between traction and Chinese herbs group, “n=4132” represents the sample size of traction group).

