-
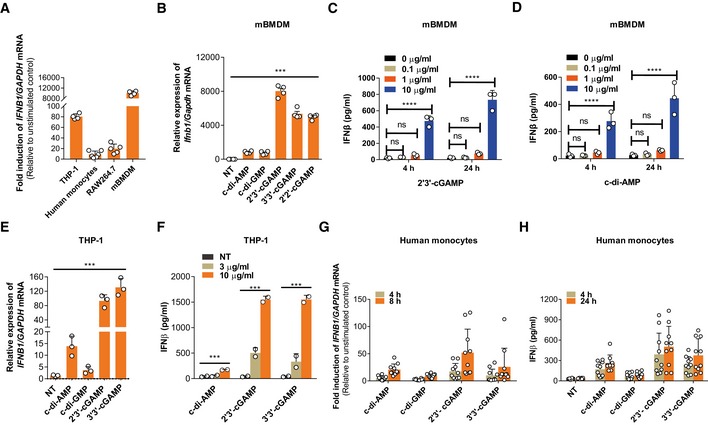
A
qRT–PCR detection of the fold induction of IFNB1 mRNA relative to unstimulated condition in different cell types. Cells were stimulated with ecGAMP (5 μg/ml) for 4 h.
-
B
qRT–PCR detection of Ifnb1 mRNA abundance in mBMDMs treated with different eCDNs (5 μg/ml) for 4 h.
-
C, D
ELISA detection of IFNβ release by mBMDMs treated for 4 h or 24 h with extracellular 2′3′‐cGAMP (C) or c‐di‐AMP (D) at indicated concentrations.
-
E
qRT–PCR detection of IFNB1 mRNA in THP‐1 cells stimulated with indicated eCDNs (5 μg/ml) for 4 h.
-
F
ELISA detection of IFNβ in supernatants of THP‐1 cells stimulated with indicated eCDNs at indicated concentrations for 4 h.
-
G
qRT–PCR detection of the fold induction of IFNB1 mRNA relative to unstimulated condition in human CD14+ monocytes derived from PBMC stimulated with indicated eCDNs (5 μg/ml) for 4 and 8 h. Each symbol represents one individual donor.
-
H
ELISA detection of IFNβ in supernatants of human CD14+ monocytes derived from PBMC stimulated with indicated eCDNs (5 μg/ml) for 4 h. Each symbol represents result from one individual donor.
Data information: Data in (A–F) are means + SD averaged from at least two independent experiments performed with technical triplicates, and each symbol represents the mean of technical triplicates. Data in (G and H) are means + SD averaged from 10 healthy donors. One‐way ANOVA (B, E) and two‐way ANOVA (C, D, F) were used for statistical analysis, respectively. ***
P < 0.001; ****
P <
0.0001.